Monitoring TrueNAS SCALE with Grafana
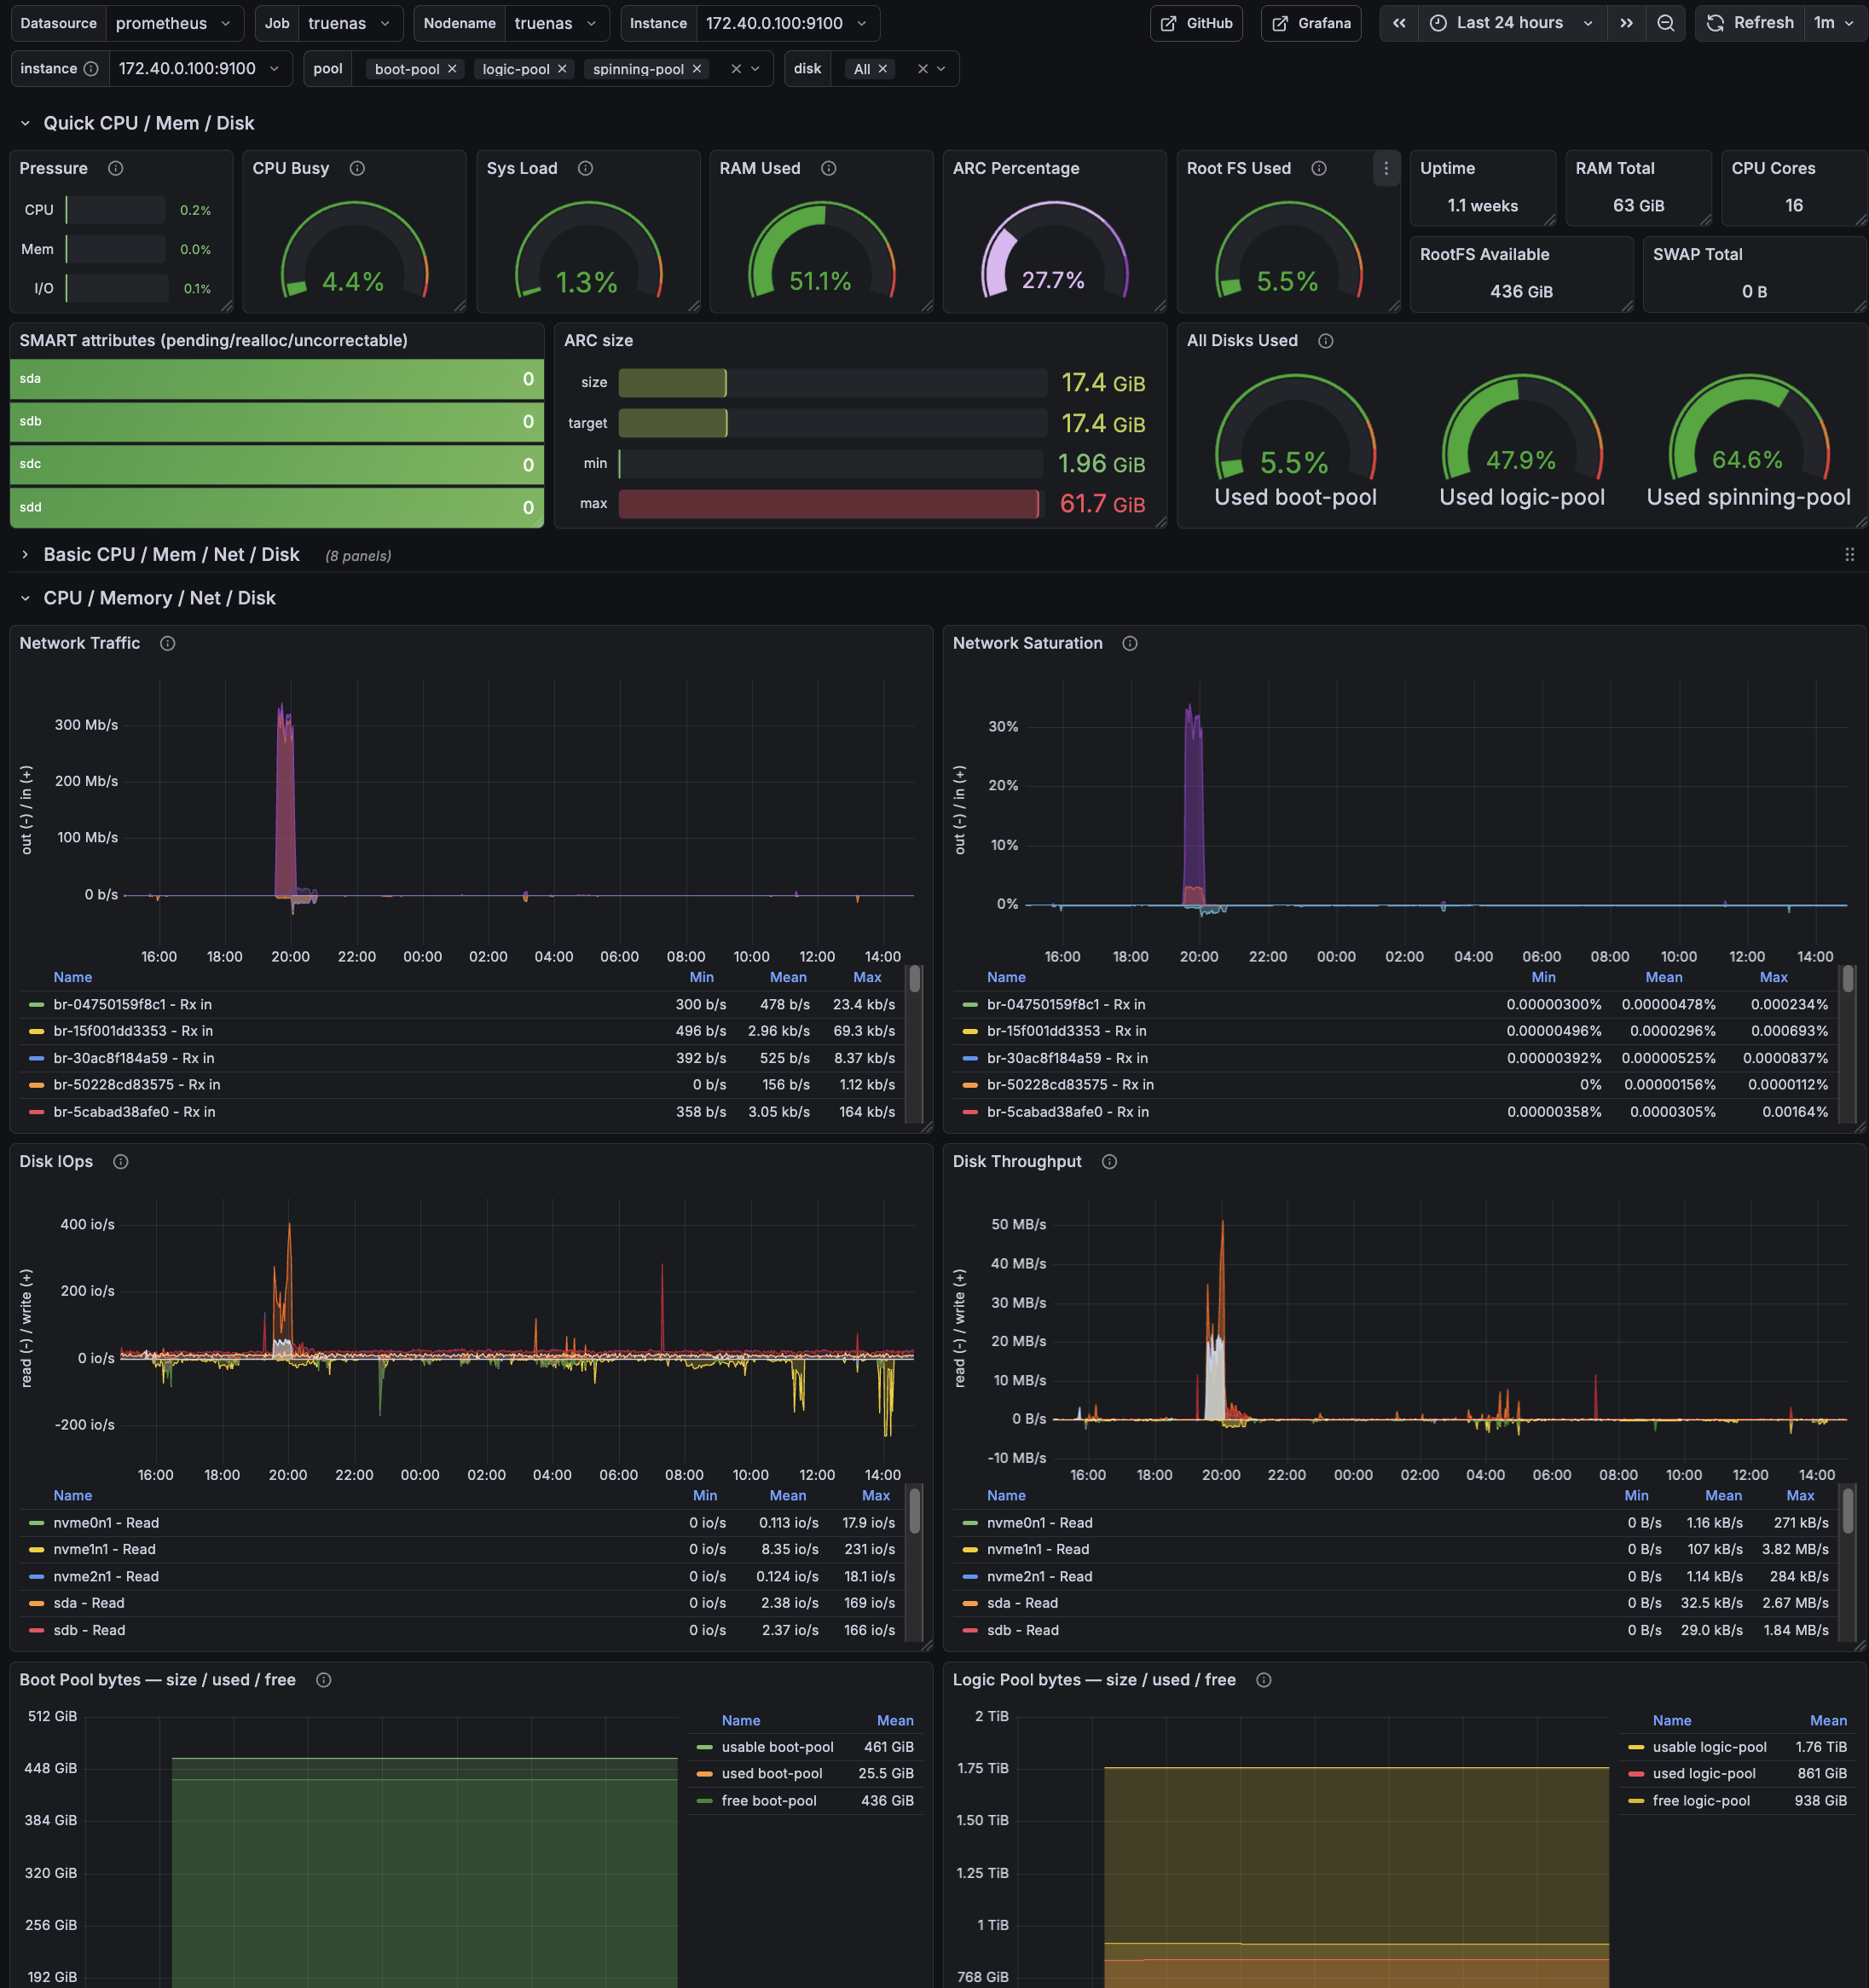
Grafana overview dashboard for TrueNAS SCALE: CPU/load, memory + ARC, ZFS pool usage, SMART status, and network/disk activity at a glance.
Grafana overview dashboard for TrueNAS SCALE: CPU/load, memory + ARC, ZFS pool usage, SMART status, and network/disk activity at a glance.
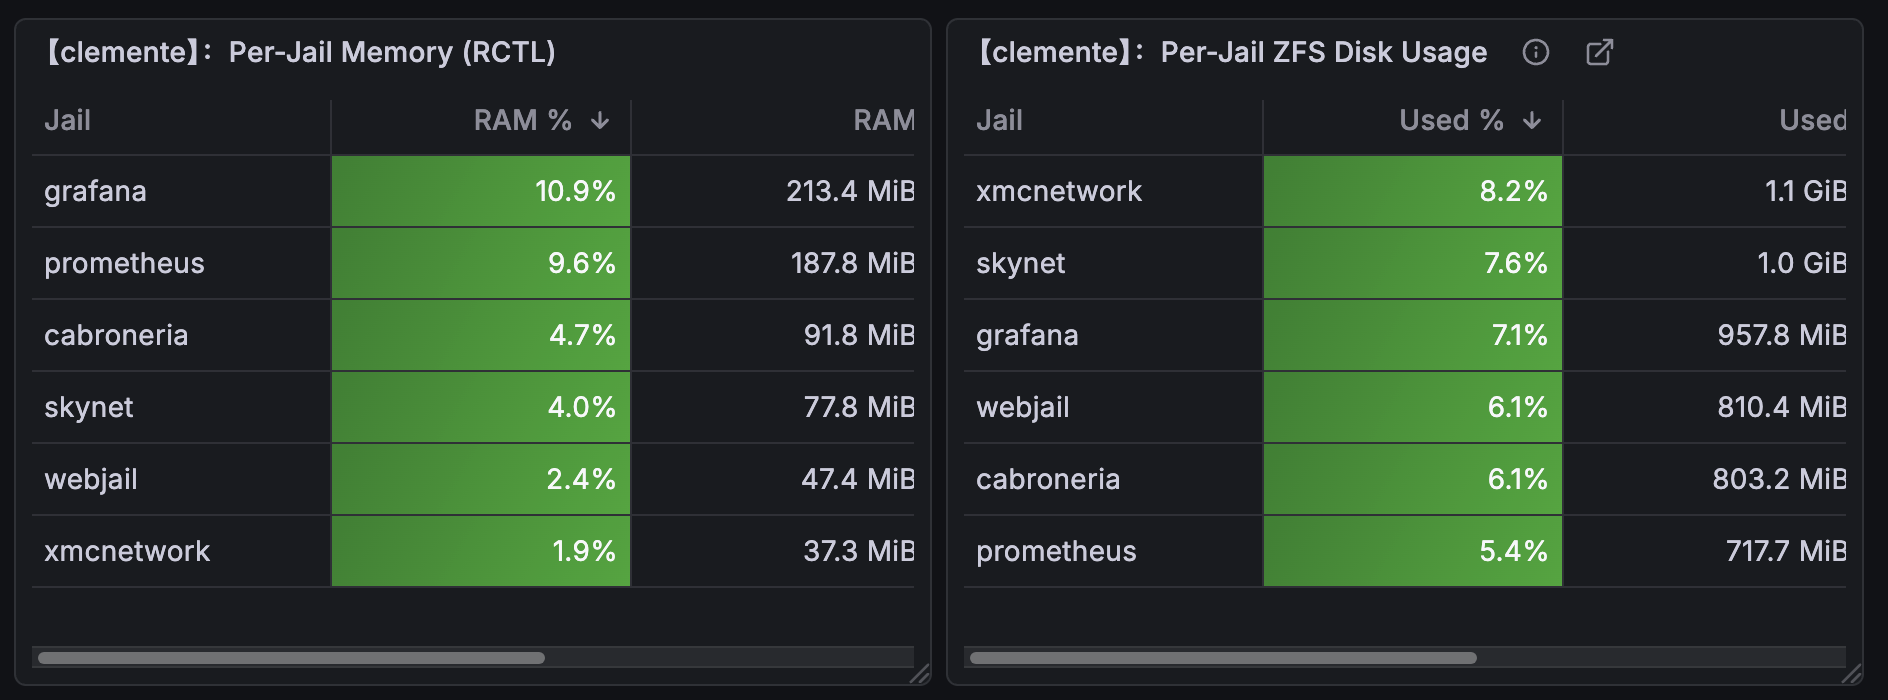
Date: 2026-02-11 per-jail RAM, VMEM, and swap metrics in Prometheus/Grafana.
Host: FreeBSD jail host
Component: RACCT/RCTL + node_exporter textfile collector
Outcome: Per-jail RAM/VMEM/SWAP metrics in Prometheus/Grafana
These are the steps I took to make an imported ZFS/Grafana dashboard work correctly on FreeBSD. The panels assumed Linux exporters and referenced metrics that do not exist on FreeBSD. The result was a dashboard full of empty panels. This walkthrough shows how I identified the missing ARC kstats, exported them cleanly, and refactored the panels to reflect the real FreeBSD kernel state.
Host: clemente (10.10.0.1)
Stack: FreeBSD + node_exporter (textfile collector) + Prometheus + Grafana
Date: 2026-02-10
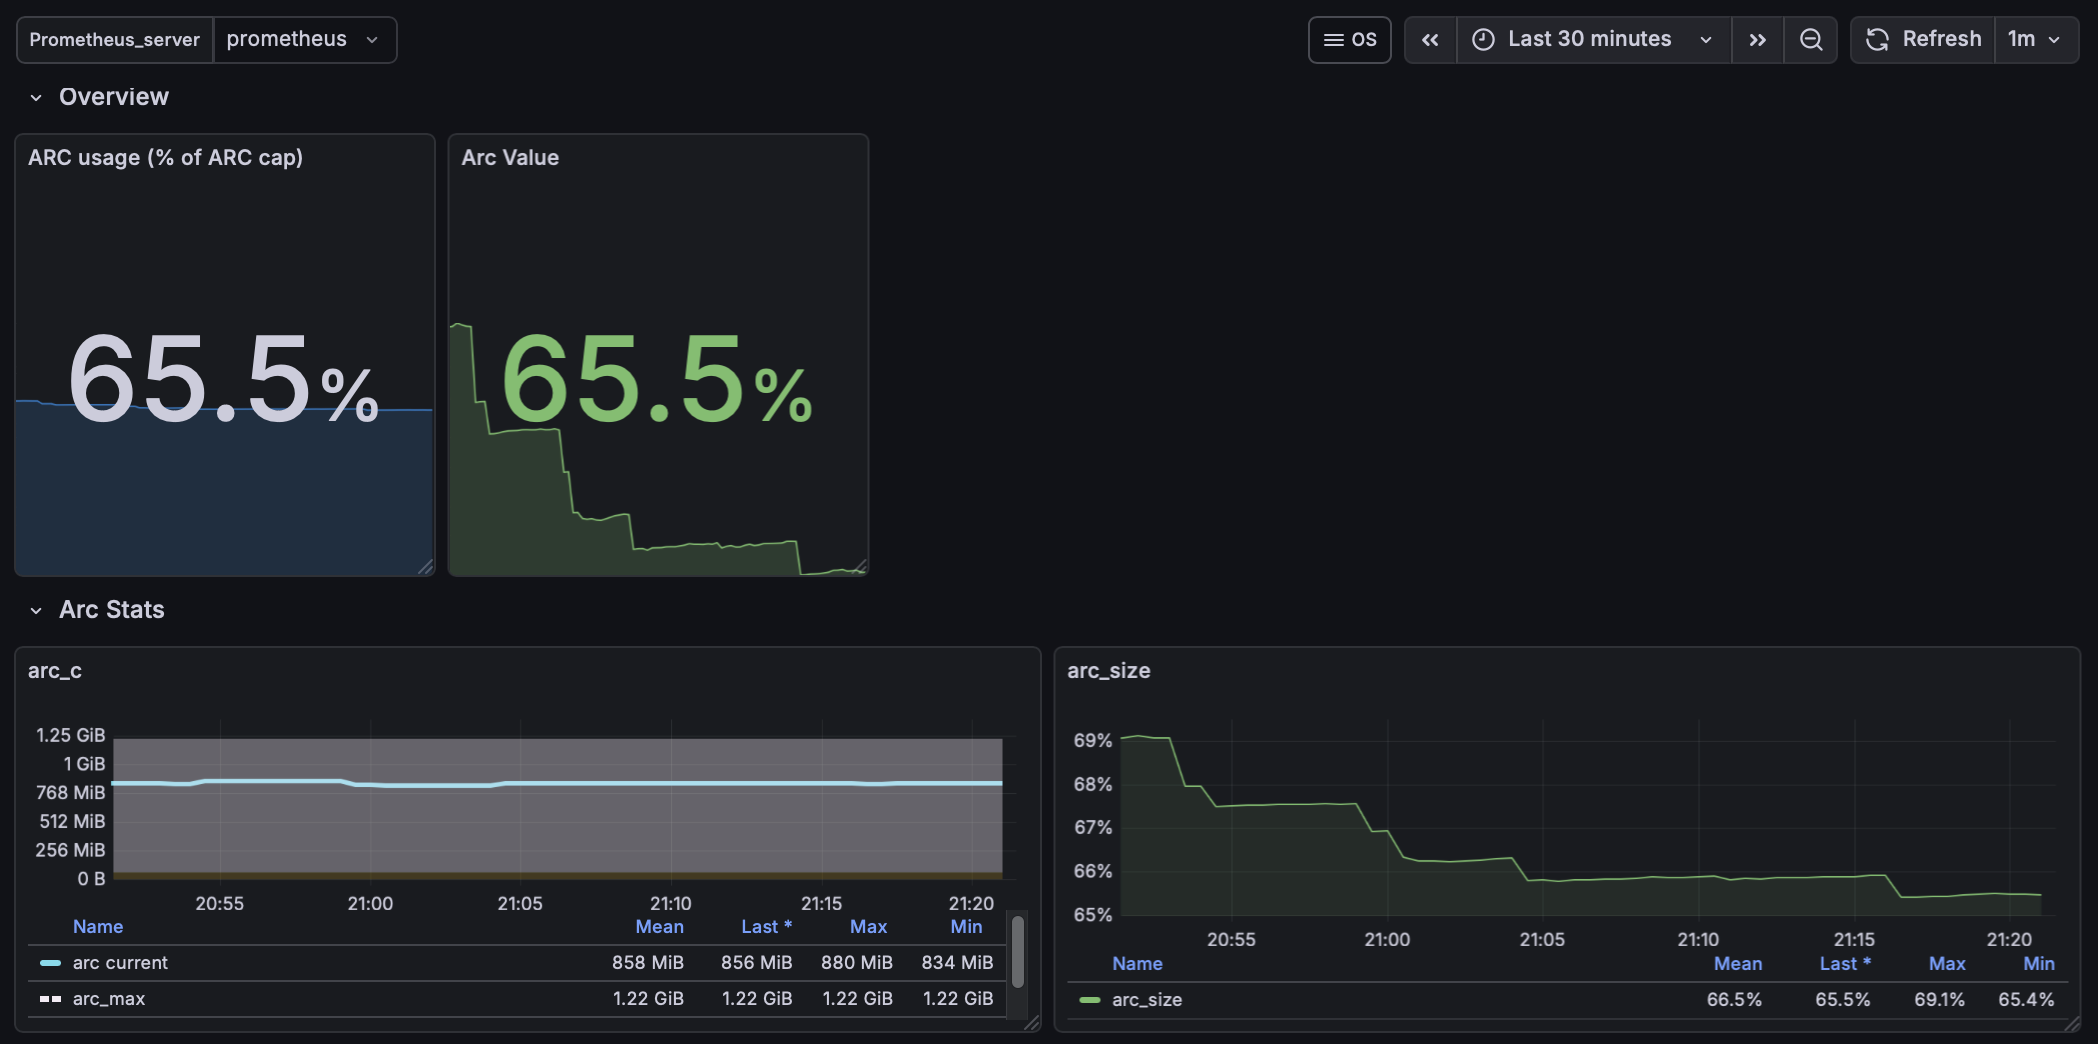
FreeBSD ZFS Grafana Panel.
Date: 2026-02-08
Host: grafana
Component: Prometheus + Grafana + exporters +zfs
Scope: ZFS monitoring
This guide sets up zpool capacity metrics (zpool list) for Prometheus/Grafana using
node-exporter’s textfile collector on FreeBSD.
This complements (not replaces) zfs_exporter, which provides ARC/internal ZFS metrics but not pool capacity.
Metrics exposed to Prometheus:
zpool_size_bytes{pool="zroot"}zpool_alloc_bytes{pool="zroot"}zpool_free_bytes{pool="zroot"}zpool_capacity_ratio{pool="zroot"}These map directly to:
…Date: 2026-02-08
Host: grafana
Component: Prometheus + Grafana + exporters
Scope: DNS monitoring
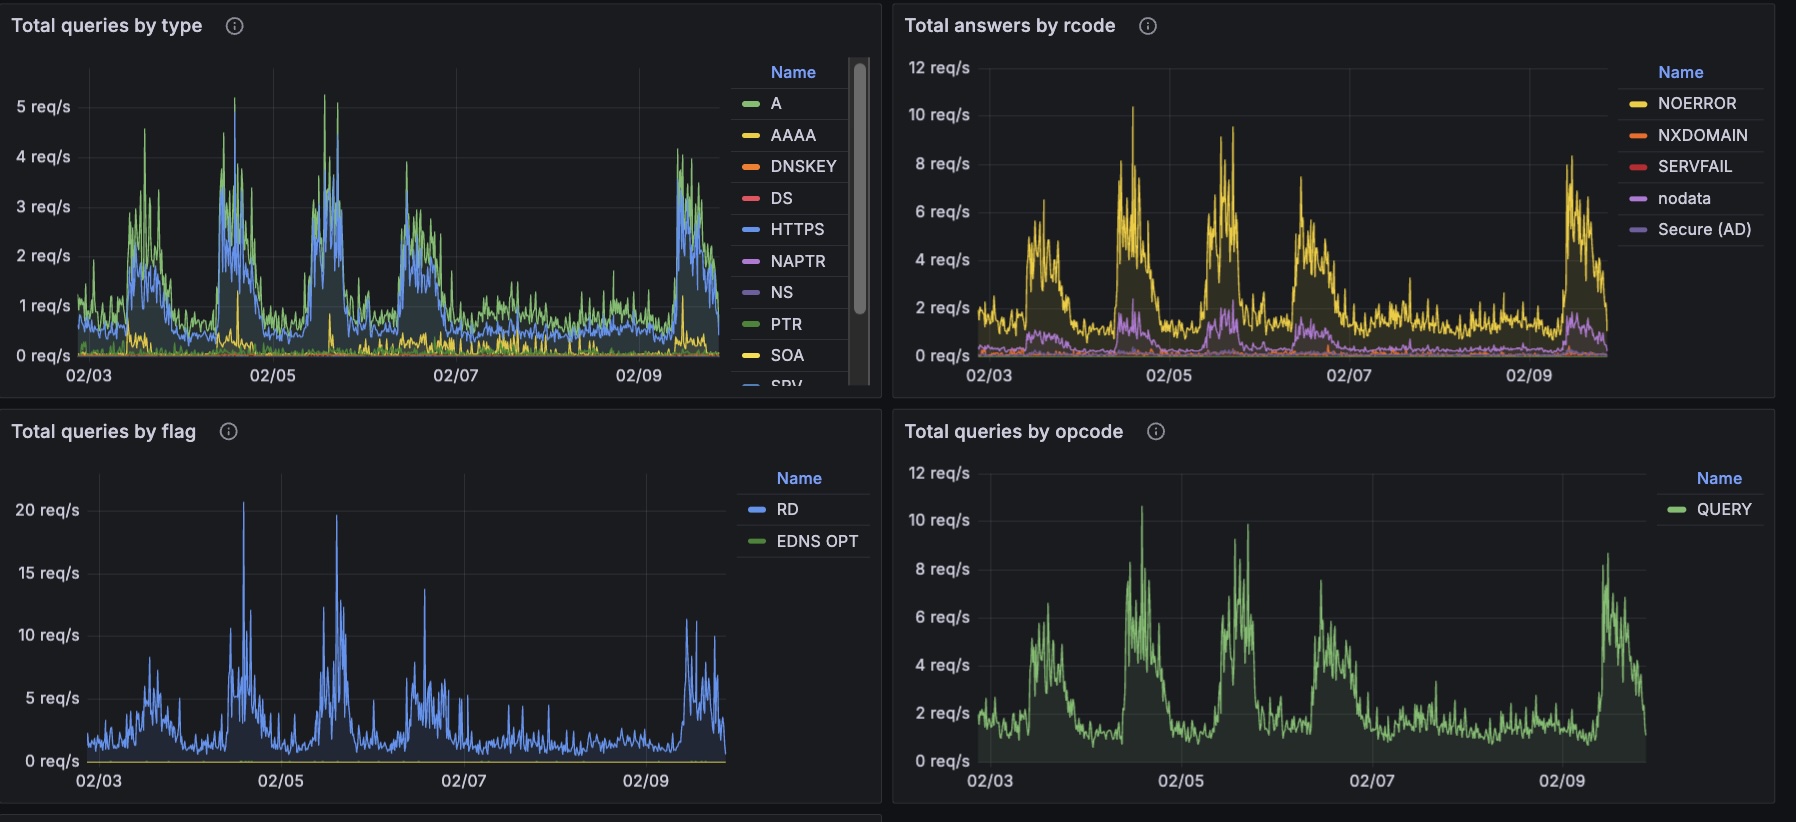
Monitoring DNS with Grafana
Date: 2026-02-08
Host: macOS (MacPorts prefix: /opt/local)
Component: doas (MacPorts)
My WireGuard client app failed to load profiles because the code path relies on doas for privilege escalation. This fix corrects the macOS (MacPorts) doas installation so the client can elevate properly.
doas: not installed setuid
…and exiting with status 1.
On macOS, MacPorts installs doas without the setuid bit by default.
Because doas is not setuid-root, it cannot elevate privileges. I depend on doas and rarely use sudo, so any command that relies on it fails immediately, including:
Date: 2026-02-08
Host: server (macOS Monterey; Homebrew prefix: /usr/local)
Grafana install: Homebrew (/usr/local/opt/grafana)
Grafana data: /usr/local/var/lib/grafana
brew services. The service needed to start at boot without a desktop login./Library/LaunchDaemons/... that runs at boot as your user.You can point Grafana at different data directories. In this setup, the running Brew Grafana server uses:
…