Monitoring DNS with Grafana
Date: 2026-02-08
Host: grafana
Component: Prometheus + Grafana + exporters
Scope: DNS monitoring
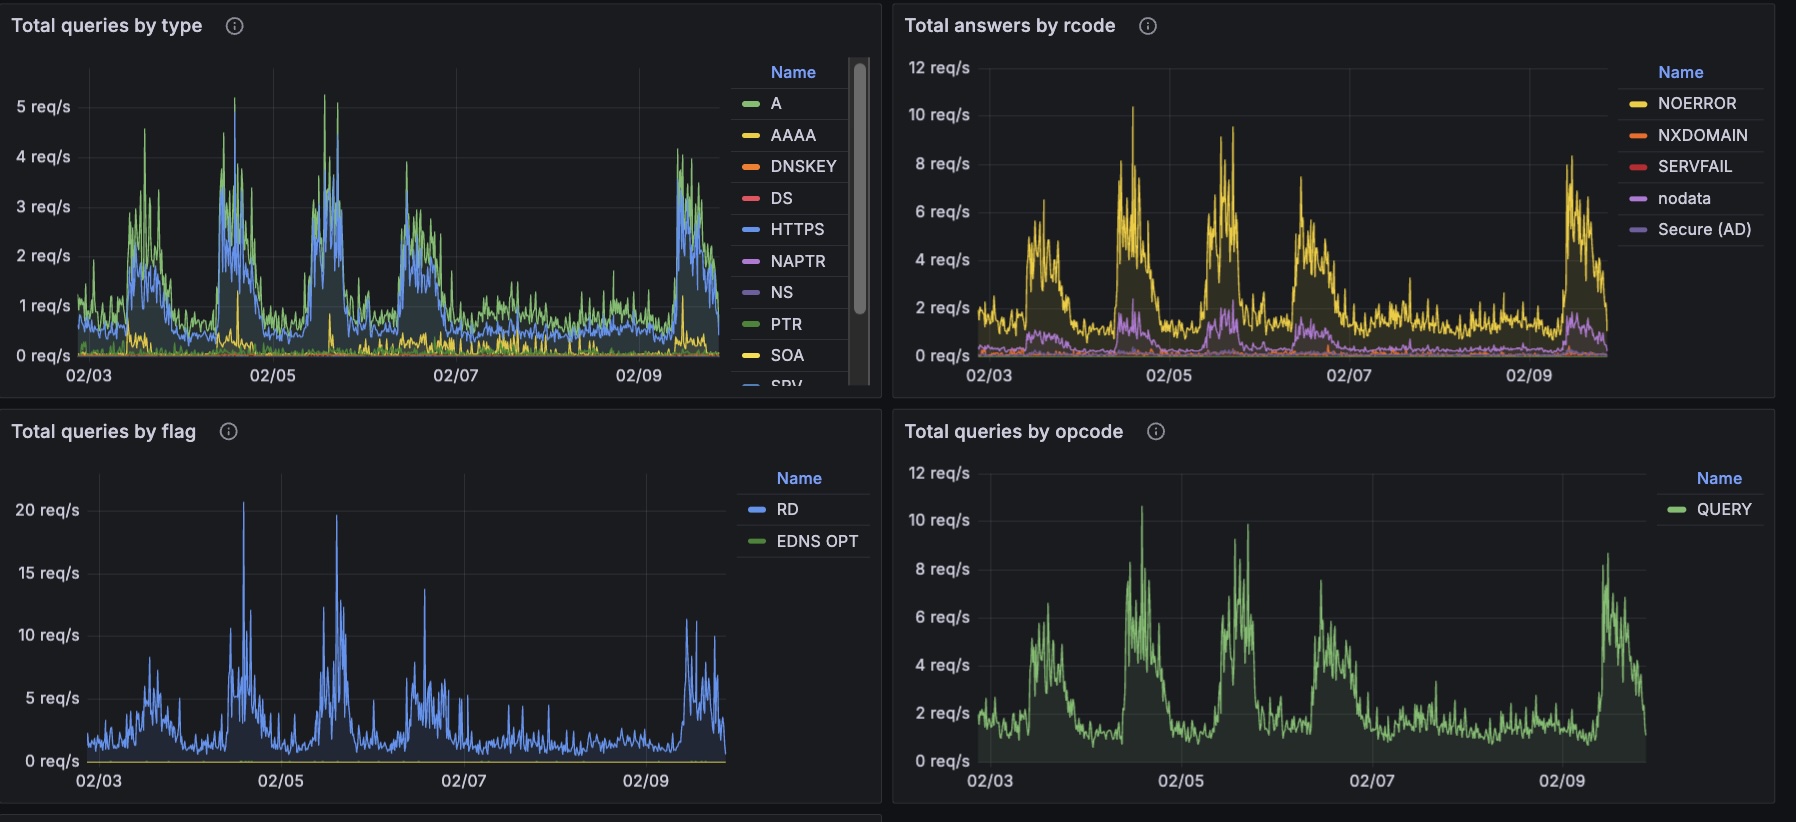
Monitoring DNS with Grafana
1️⃣ Inside the jail: install Grafana
pkg update
pkg install -y grafana

grafana: 12.3.0_3 [FreeBSD-ports]
This installs:
- grafana binary
- Config in /usr/local/etc/grafana/
- Service script: /usr/local/etc/rc.d/grafana
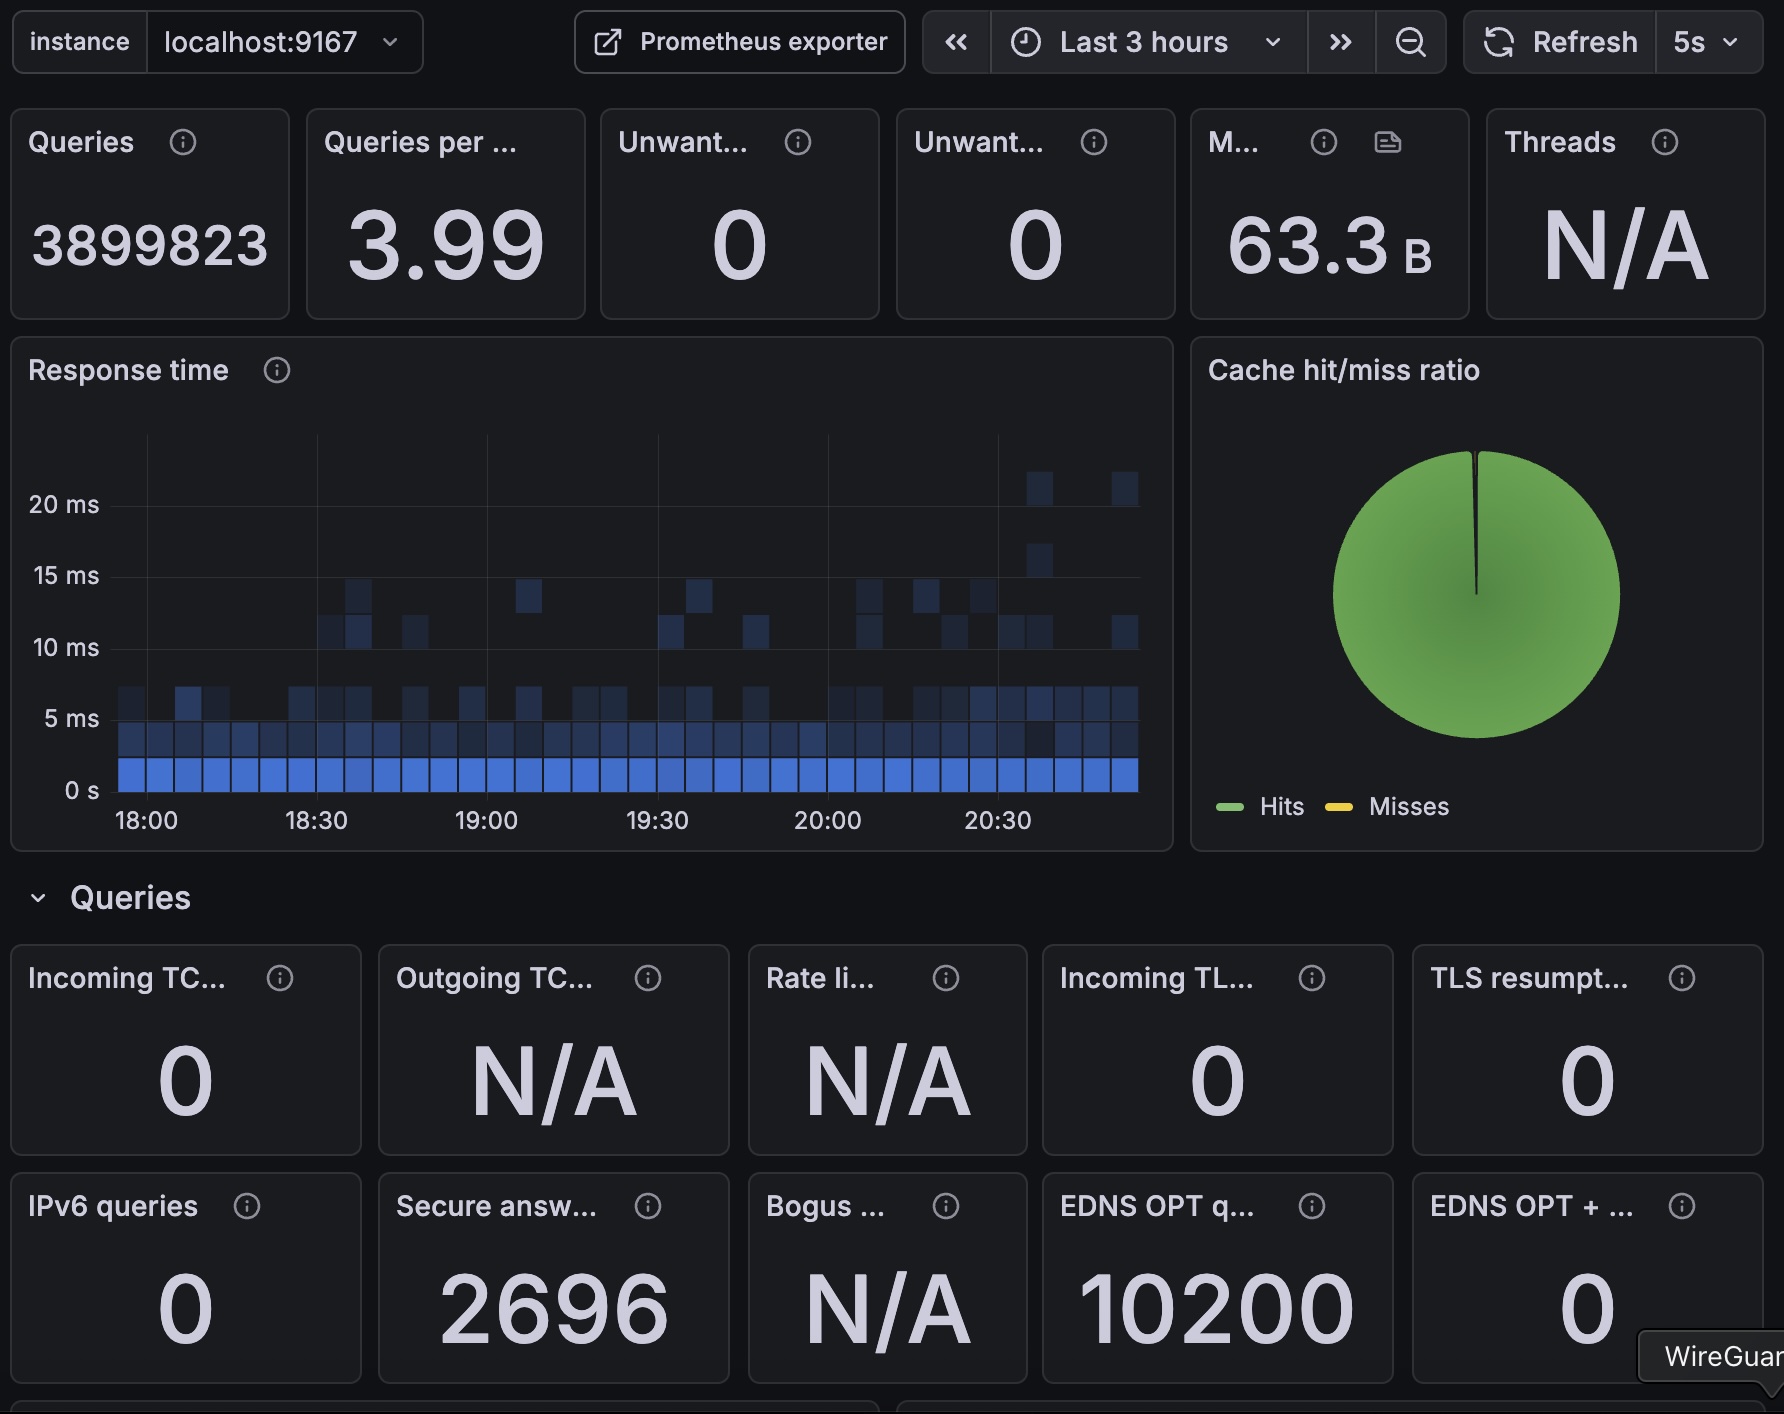
2️⃣ Enable Grafana service in the jail
sysrc grafana_enable=YES
Start it:
service grafana start
http://10.10.0.10:3000/login
4️⃣ Bind Grafana to the jail IP (recommended)
nano /usr/local/etc/grafana/grafana.ini
Set:
[server]

# The ip address to bind to, empty will bind to all interfaces
http_addr = 10.10.0.10

# The http port to use
http_port = 3000

# The public facing domain name used to access grafana from a browser
domain = grafana.cabroneria.com
Add procfs mount (optional, but prevents plugin pain)
Grafana core does not require procfs. But some plugins, diagnostics, and Go runtime checks work better with it.
In your jail fstab (/usr/local/bastille/jails/grafana/fstab), add:
procfs /usr/local/bastille/jails/grafana/root/proc procfs rw 0 0
jail.conf
/usr/local/bastille/jails/grafana/jail.conf
5️⃣ Install prometheus
pkg install -y prometheus
sysrc prometheus_enable=YES
Start it:
service prometheus start
/usr/local/etc/prometheus.yml
global:
  scrape_interval: 15s
  evaluation_interval: 15s

scrape_configs:
  # Prometheus itself
  - job_name: "prometheus"
    static_configs:
      - targets: ["127.0.0.1:9090"]
        labels:
          role: "monitoring"
          node: "prometheus-jail"

  # The FreeBSD HOST running node_exporter
  - job_name: "host"
    static_configs:
      - targets: ["10.44.0.1:9100"]     # <-- host IP here
        labels:
          role: "host"
          node: "clemente"               # <-- host name label

  # All jails running node_exporter
  - job_name: "jails"
    static_configs:
      - targets:
          - "10.10.0.10:9100"           # grafana jail
          - "10.10.0.11:9100"           # prometheus jail (optional scrape)
          - "10.10.0.20:9100"           # skynet
          - "10.10.0.30:9100"           # webjail
          - "10.10.0.40:9100"           # cabroneria
          - "10.10.0.50:9100"           # xmcnetwork
          # - "10.10.0.20:9100"         # other jail
        labels:
          role: "jail"
Prometheus checks
✅ Quick health checks
fetch -qo- http://127.0.0.1:9090/-/healthy
fetch -qo- http://127.0.0.1:9090/-/ready
✅ See scrape targets in a text-ish way (JSON)
Prometheus exposes targets via the API:
fetch -qo- "http://127.0.0.1:9090/api/v1/targets?state=active" | head
For formatted output (optional):
pkg install -y jq
fetch -qo- "http://127.0.0.1:9090/api/v1/targets?state=active" | jq '.data.activeTargets[] | {job: .labels.job, instance: .labels.instance, health: .health, lastError: .lastError}'
1️⃣ Install exporters
On the HOST
pkg install -y node_exporter
sysrc node_exporter_enable=YES
service node_exporter start
Verify:
sockstat -4 -l | grep 9100
nobody node_expor 20341  3 tcp46 *:9100                *:*
In EACH JAIL (including grafana jail if self-monitoring)
bastille console grafana
pkg install -y node_exporter
sysrc node_exporter_enable=YES
service node_exporter start
sockstat -4 -l | grep 9100
1) Add Prometheus datasource in Grafana
Grafana UI Connections / Data sources / Add data source / Prometheus