FreeBSD Jail Memory Metrics
Date: 2026-02-11 per-jail RAM, VMEM, and swap metrics in Prometheus/Grafana.
Host: FreeBSD jail host
Component: RACCT/RCTL + node_exporter textfile collector
Outcome: Per-jail RAM/VMEM/SWAP metrics in Prometheus/Grafana
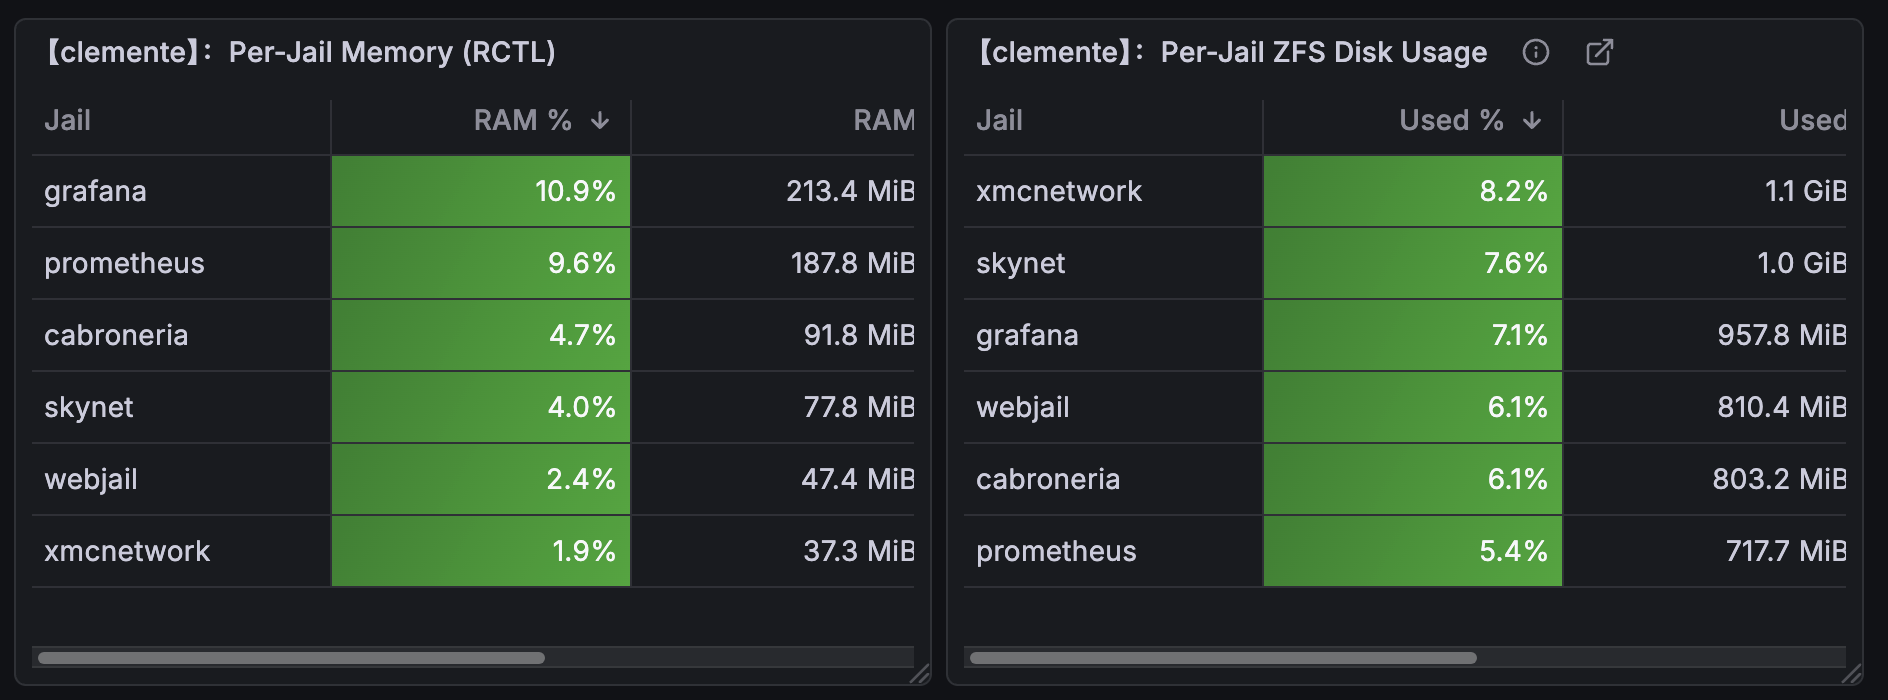
One of the most useful improvements I made recently was per-jail memory visibility, with jail_mem_prom.sh.
Memory usage on FreeBSD felt like a black box at the jail level. I could see host pressure, but not how individual services actually behaved. So I exported per-jail memory metrics. Now I can tell which jail quietly uses excess RAM, which ones spike under load, and which behave exactly as expected.
It turns vague suspicion into concrete signals, and that alone makes capacity planning and debugging dramatically less painful.
FreeBSD Per-Jail Memory Metrics (RACCT/RCTL via Prometheus via node_exporter)
This guide enables per-jail memory accounting on FreeBSD, with RACCT/RCTL. It exports the metrics to Prometheus/Grafana through node_exporter’s textfile collector.
This is real per-jail accounting, not an approximation from summed RSS values. It is the missing piece when you run many services inside jails.
What you get
Exported Prometheus metrics (per jail):
jail_memoryuse_bytes{jail="<name>"}jail_vmemoryuse_bytes{jail="<name>"}jail_swapuse_bytes{jail="<name>"}
Mapped from:
rctl -u jail:<name>
Fields used:
Per-jail memory metrics (RACCT / rctl)
├─ memoryuse  --> resident memory used (RSS)
├─ vmemoryuse --> virtual memory footprint (VM size)
└─ swapuse    --> swap consumption
1) Verify RACCT support exists
sysctl kern.racct.enable
If the OID exists, your kernel includes RACCT/RCTL. If it does not exist, your kernel does not include RACCT/RCTL.
2) Enable RACCT at boot
Edit:
/boot/loader.conf
Add:
kern.racct.enable="1"
Reboot the host.
Verify after reboot:
sysctl kern.racct.enable
Expected:
kern.racct.enable: 1
3) Verify rctl works (root)
doas su
rctl -u jail:skynet
Example fields you should see:
memoryuse=...
vmemoryuse=...
swapuse=...
4) Create the exporter script (node_exporter textfile collector)
Save as:
/usr/local/bin/jail_mem_prom.sh
#!/bin/sh

OUT="/var/db/node_exporter/textfile_collector/jail_mem.prom.$$"
FINAL="/var/db/node_exporter/textfile_collector/jail_mem.prom"

{
  echo "# HELP jail_memoryuse_bytes Per-jail resident memory usage (rctl memoryuse) in bytes"
  echo "# TYPE jail_memoryuse_bytes gauge"
  echo "# HELP jail_vmemoryuse_bytes Per-jail virtual memory usage (rctl vmemoryuse) in bytes"
  echo "# TYPE jail_vmemoryuse_bytes gauge"
  echo "# HELP jail_swapuse_bytes Per-jail swap usage (rctl swapuse) in bytes"
  echo "# TYPE jail_swapuse_bytes gauge"

  jls -q name | while read -r jail; do
    [ -z "$jail" ] && continue
    rctl -u "jail:${jail}" 2>/dev/null | awk -F= -v j="$jail" '
      $1=="memoryuse"   { printf "jail_memoryuse_bytes{jail=\"%s\"} %s\n", j, $2 }
      $1=="vmemoryuse"  { printf "jail_vmemoryuse_bytes{jail=\"%s\"} %s\n", j, $2 }
      $1=="swapuse"     { printf "jail_swapuse_bytes{jail=\"%s\"} %s\n", j, $2 }
    '
  done
} > "$OUT" && mv "$OUT" "$FINAL"
Make it executable and test:
chmod +x /usr/local/bin/jail_mem_prom.sh
doas /usr/local/bin/jail_mem_prom.sh
tail -n 50 /var/db/node_exporter/textfile_collector/jail_mem.prom
5) Ensure node_exporter reads the textfile directory
In /etc/rc.conf:
node_exporter_enable="YES"
node_exporter_args="--collector.textfile.directory=/var/db/node_exporter/textfile_collector"
Restart:
service node_exporter restart
Verify metrics are exposed:
curl -s http://127.0.0.1:9100/metrics | egrep '^jail_(memoryuse|vmemoryuse|swapuse)_bytes'
6) Schedule the exporter (root cron)
doas crontab -e
Add:
* * * * * /usr/local/bin/jail_mem_prom.sh >/dev/null 2>&1
7) PromQL / Grafana examples
Per-jail resident memory:
jail_memoryuse_bytes
Top 5 RAM users:
topk(5, jail_memoryuse_bytes)
Virtual memory:
jail_vmemoryuse_bytes
Swap usage:
jail_swapuse_bytes
If you want a percent-of-host panel:
100 * jail_memoryuse_bytes / node_memory_MemTotal_bytes
Notes
- This is accurate per-jail accounting via RACCT/RCTL (unlike RSS summation).
- The exporter must run as root (cron as root) to read
rctlusage.
Conclusion
You now have per-jail RAM, VMEM, and swap metrics in Prometheus/Grafana. Memory visibility now goes beyond the host level, and you can debug it more easily.