Monitoring TrueNAS SCALE with Grafana
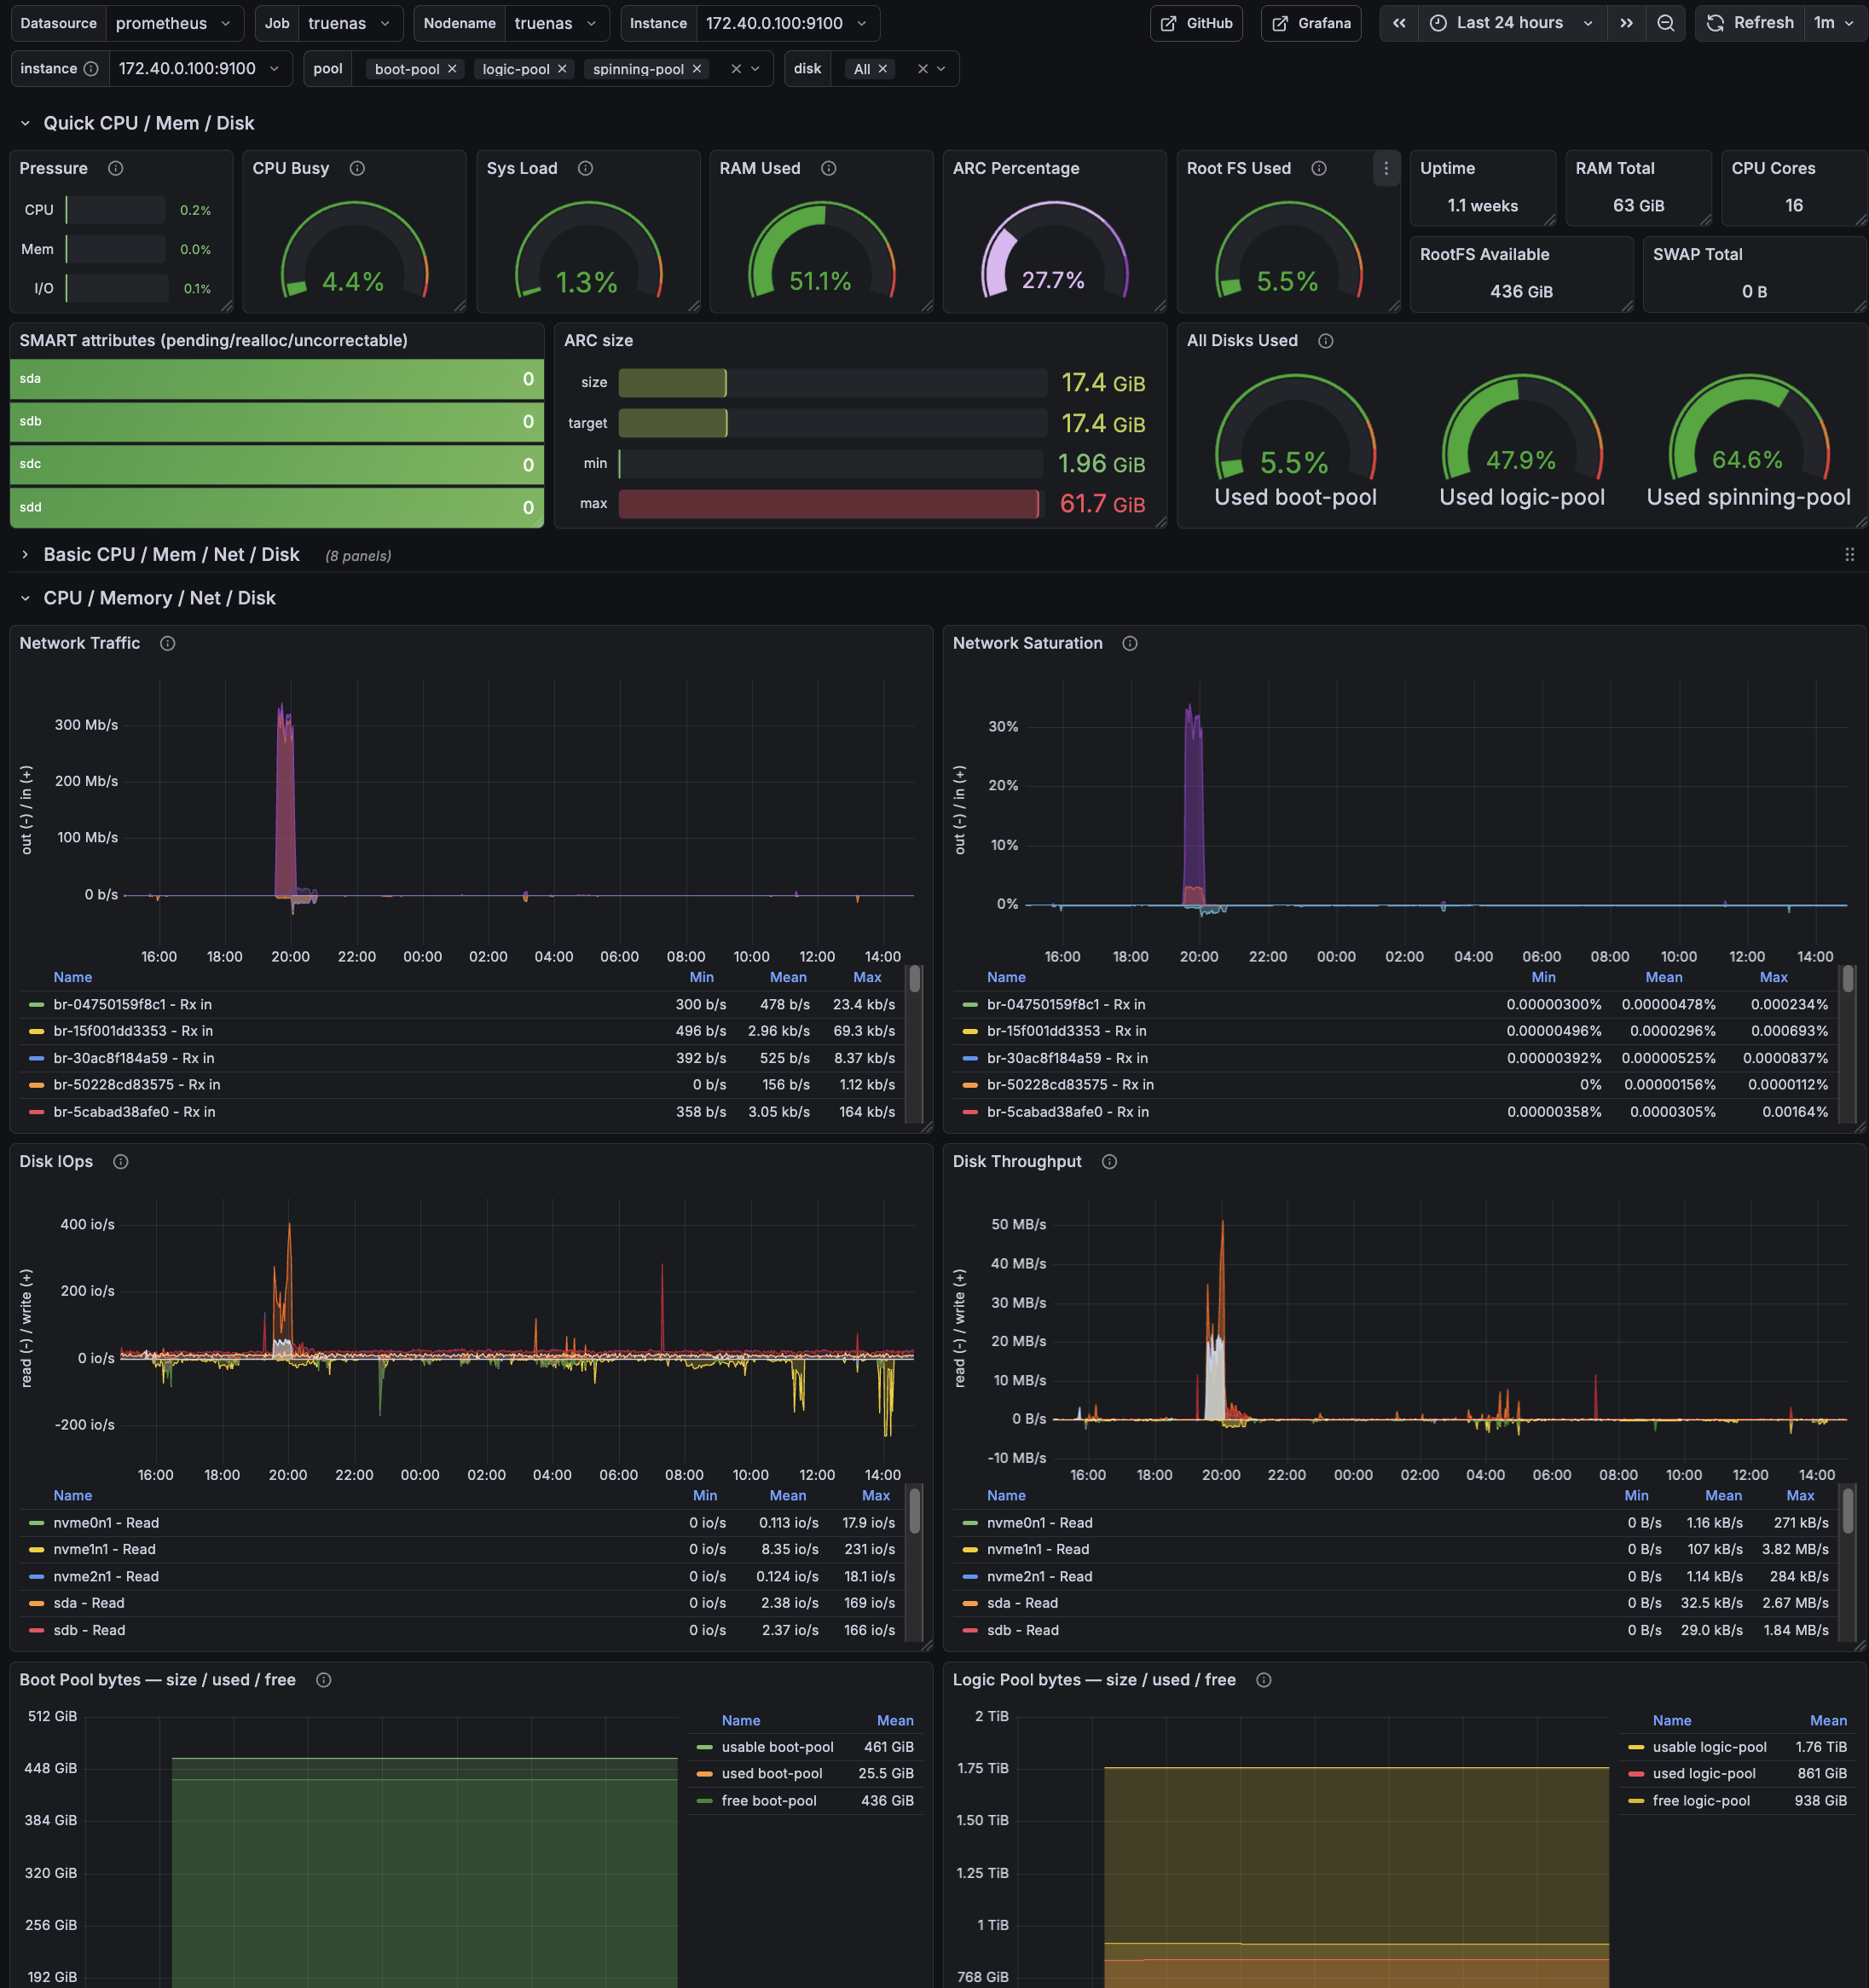
Grafana overview dashboard for TrueNAS SCALE: CPU/load, memory + ARC, ZFS pool usage, SMART status, and network/disk activity at a glance.
Grafana overview dashboard for TrueNAS SCALE: CPU/load, memory + ARC, ZFS pool usage, SMART status, and network/disk activity at a glance.
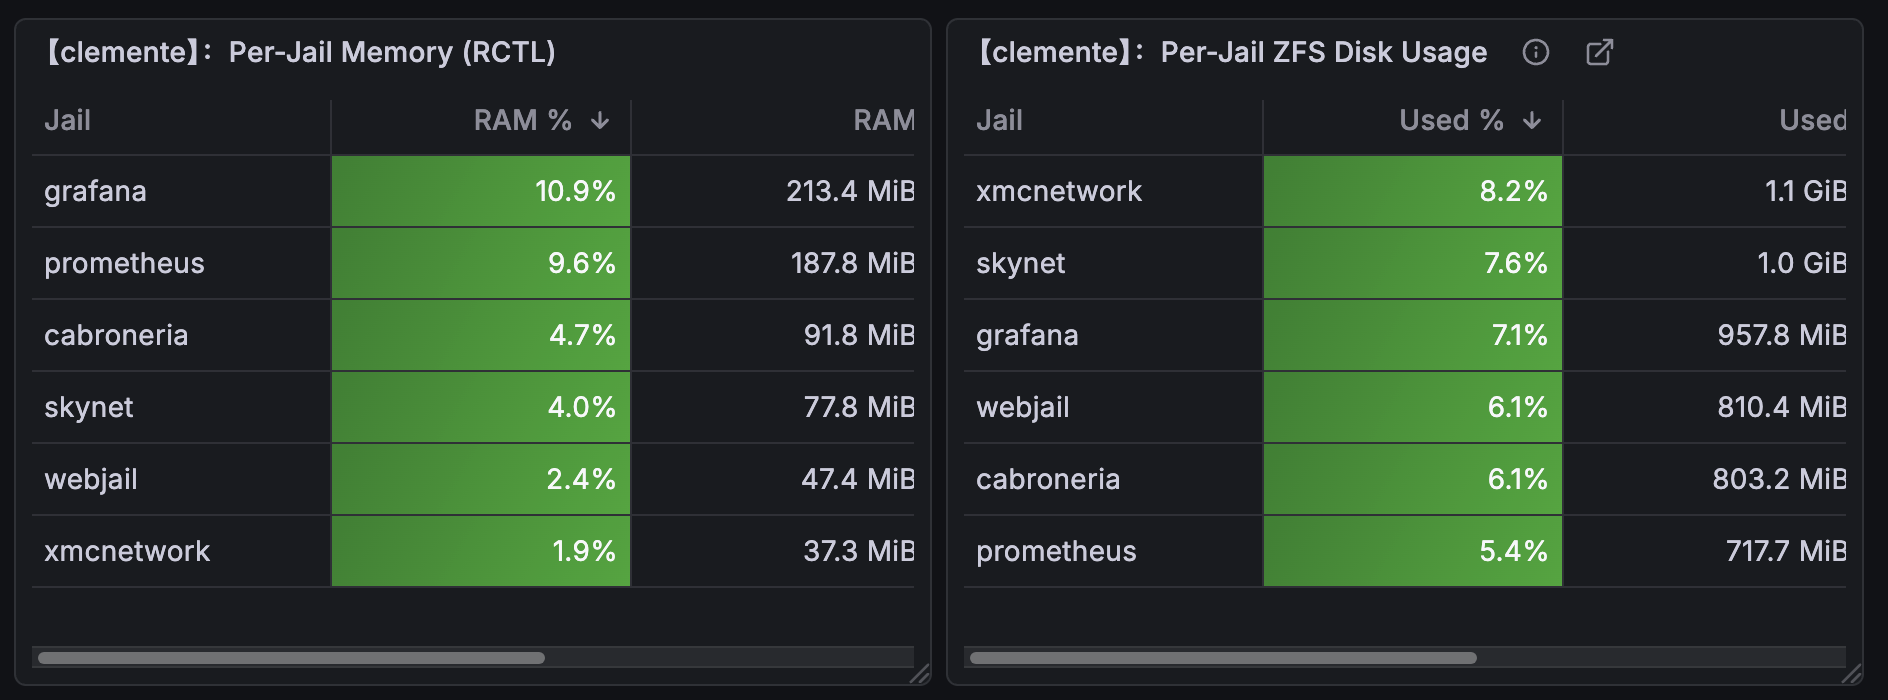
Date: 2026-02-11 per-jail RAM, VMEM, and swap metrics in Prometheus/Grafana.
Host: FreeBSD jail host
Component: RACCT/RCTL + node_exporter textfile collector
Outcome: Per-jail RAM/VMEM/SWAP metrics in Prometheus/Grafana
Steps taken to make an imported ZFS/Grafana dashboard work correctly on FreeBSD. Panels assumed Linux exporters and referenced metrics that do not exist on FreeBSD. The result was a dashboard full of empty panels. This walkthrough shows how the missing ARC kstats where identified, cleanly exported and refactored so that the panels reflect the real FreeBSD kernel state.
Host: clemente (10.10.0.1)
Stack: FreeBSD + node_exporter (textfile collector) + Prometheus + Grafana
Date: 2026-02-10
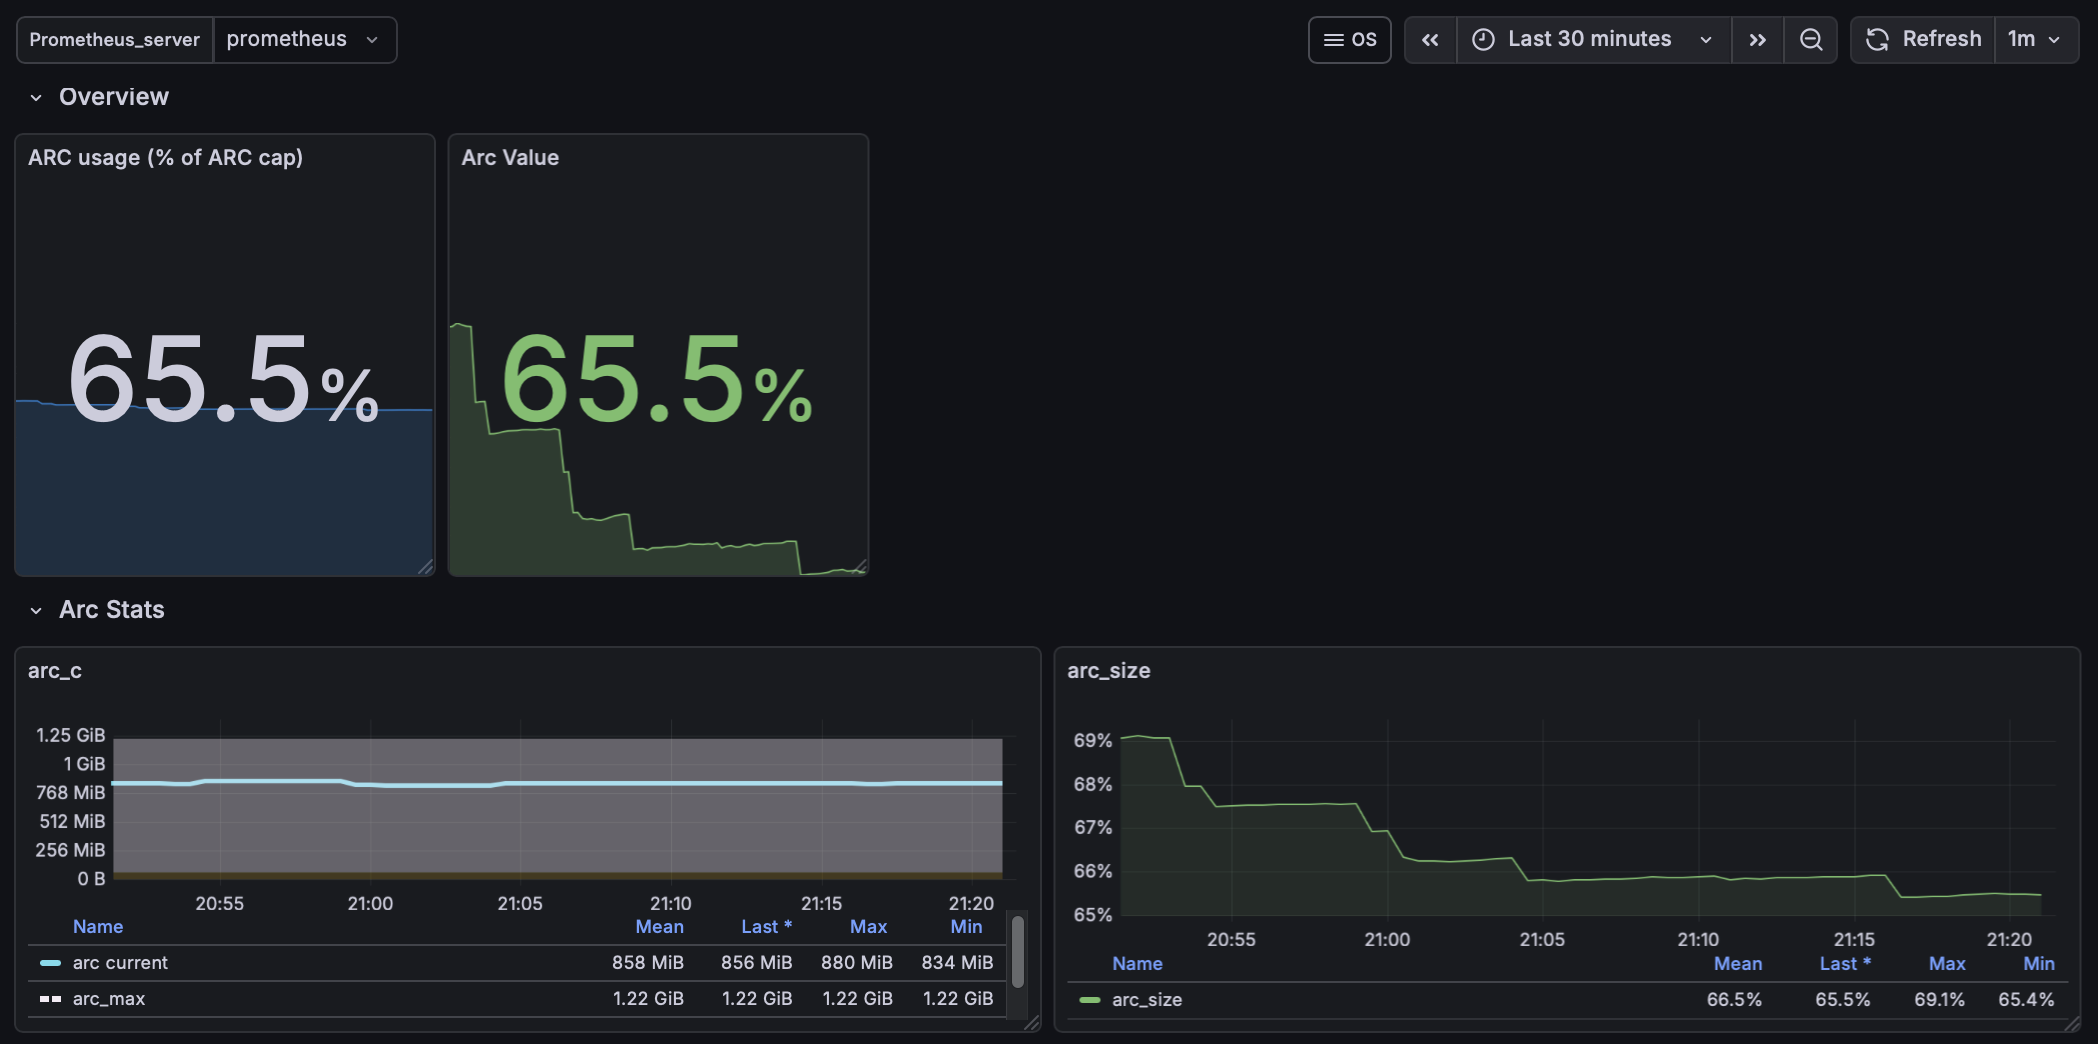
FreeBSD ZFS Grafana Panel.
Date: 2026-02-08
Host: grafana
Component: Prometheus + Grafana + exporters +zfs
Scope: ZFS monitoring
This guide sets up zpool capacity metrics (zpool list) for Prometheus/Grafana using
node-exporter’s textfile collector on FreeBSD.
This complements (not replaces) zfs_exporter, which provides ARC/internal ZFS metrics but not pool capacity.
Metrics exposed to Prometheus:
zpool_size_bytes{pool="zroot"}zpool_alloc_bytes{pool="zroot"}zpool_free_bytes{pool="zroot"}zpool_capacity_ratio{pool="zroot"}These map directly to:
…Date: 2026-02-08
Host: grafana
Component: Prometheus + Grafana + exporters
Scope: DNS monitoring
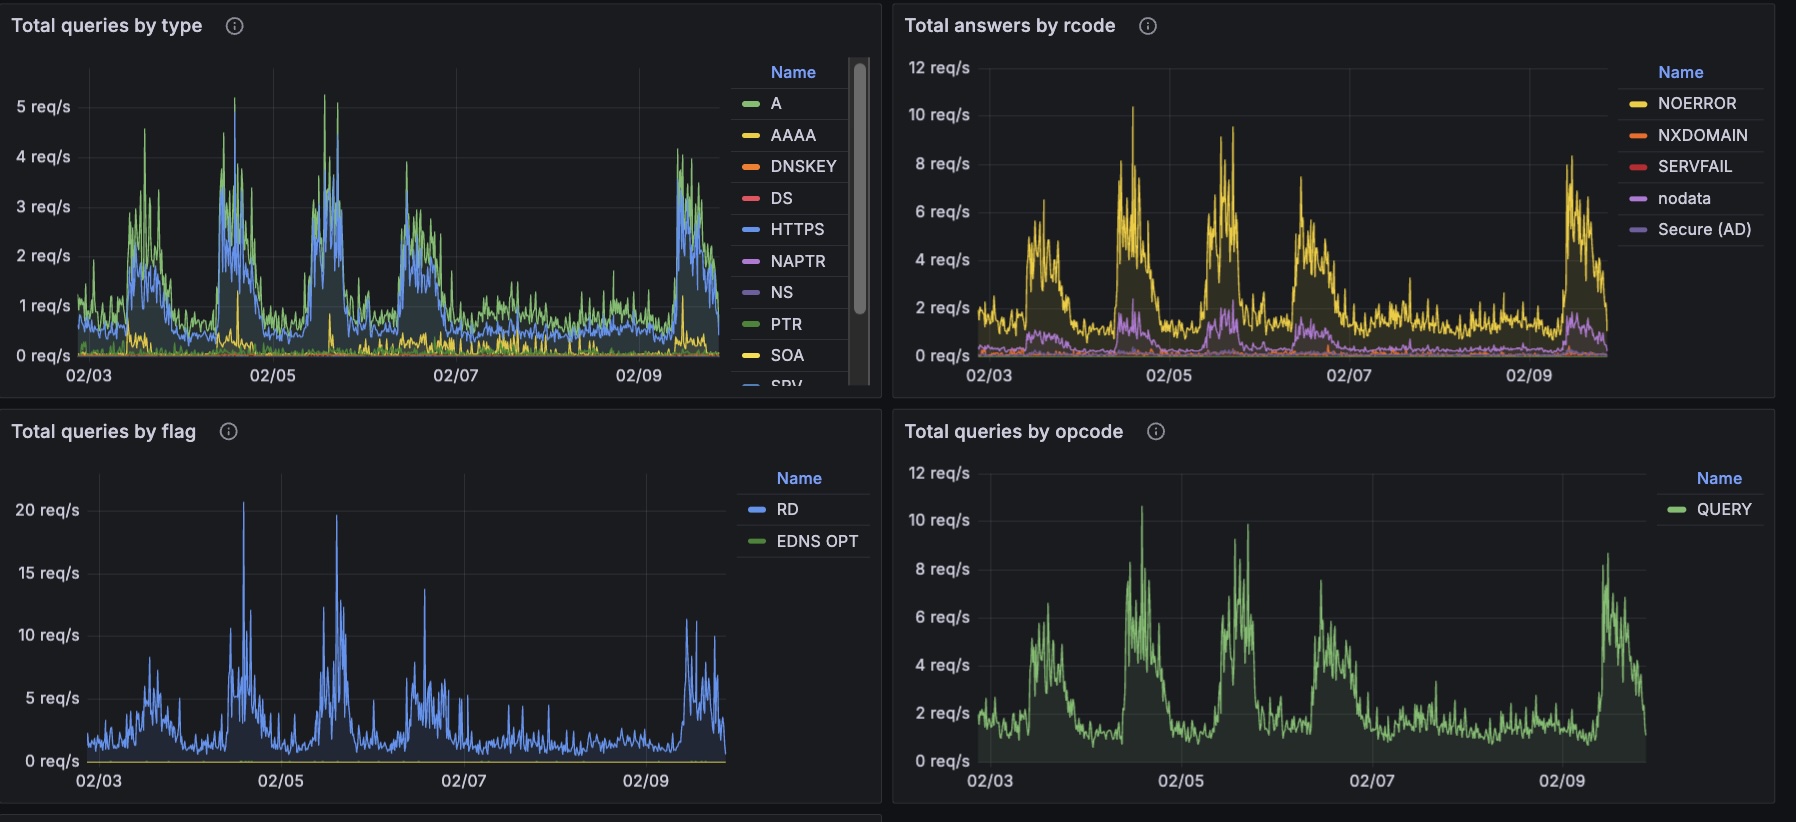
Monitoring DNS with Grafana