Making ZFS ARC Grafana Panels FreeBSD-Compatible
Making ZFS ARC Grafana Panels FreeBSD-Compatible
Steps taken to make an imported ZFS/Grafana dashboard work correctly on FreeBSD. Panels assumed Linux exporters and referenced metrics that do not exist on FreeBSD. The result was a dashboard full of empty panels. This walkthrough shows how the missing ARC kstats where identified, cleanly exported and refactored so that the panels reflect the real FreeBSD kernel state.
Host: clemente (10.10.0.1)
Stack: FreeBSD + node_exporter (textfile collector) + Prometheus + Grafana
Date: 2026-02-10
Overview (Context & Goal)
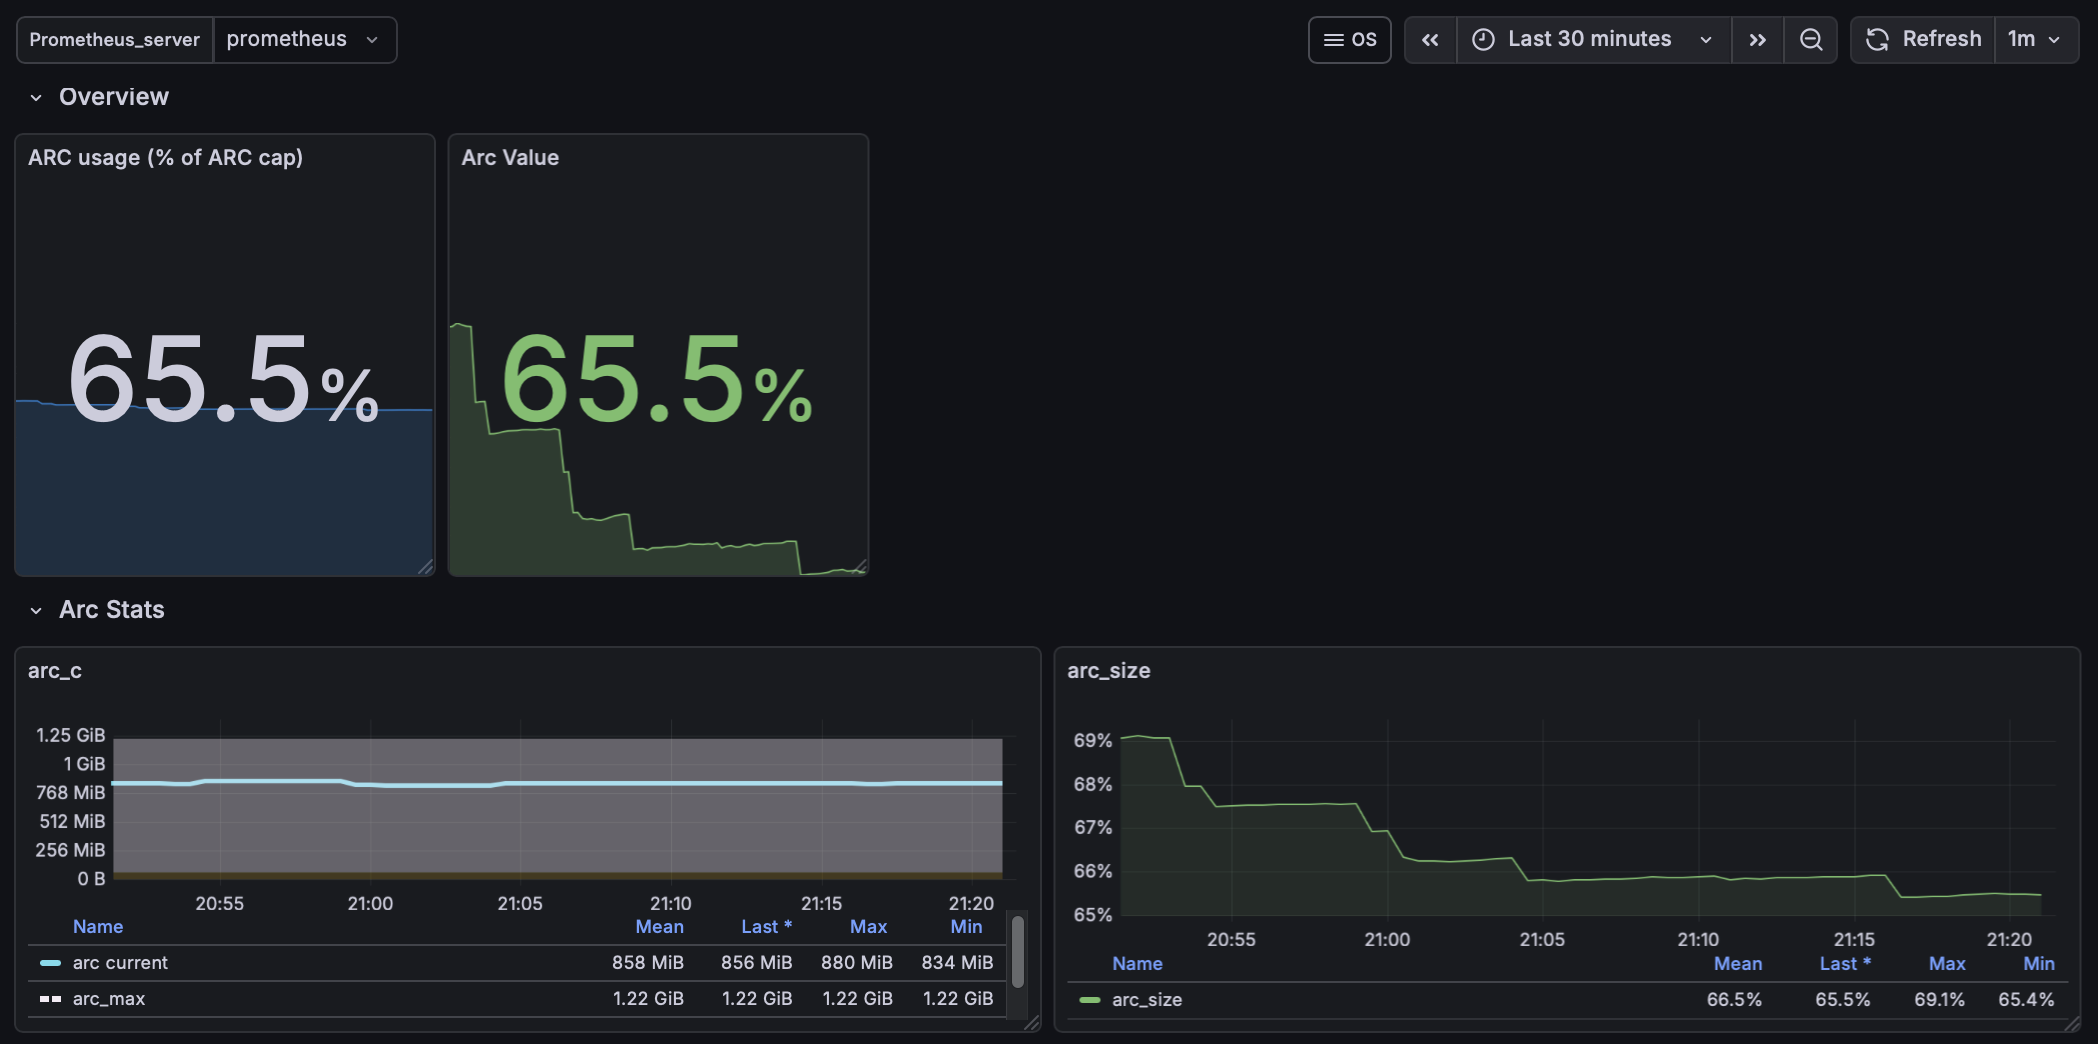
FreeBSD ZFS Grafana Panel.
Problem:
-
FreeBSD’s node_exporter / zfs_exporter do not expose the full ARC kstats set.
-
Several imported panels referenced
sysctl_kstat_*series that did not exist in our stack. -
Result: “No data” panels and misleading dashboards. Solution:
-
Identify the missing ARC kstats on FreeBSD (
kstat.zfs.misc.arcstats.*). -
Export the missing fields via node_exporter textfile collectors.
-
Standardize metric names and panel queries.
-
Group collectors and cron jobs cleanly.
-
Replace dead panels with FreeBSD-valid metrics.
Data flow
FreeBSD kernel metrics
└── sysctl: kstat.zfs.misc.arcstats.*
    └── Custom shell collectors
        └── node_exporter textfile collector (/var/db/node_exporter/textfile_collector)
            └── Prometheus scrape
                └── Grafana panels (FreeBSD-compatible ARC visualizations)
Services Enabled
/etc/rc.conf
node_exporter_enable="YES"
node_exporter_args="--collector.textfile.directory=/var/db/node_exporter/textfile_collector"
zfs_exporter_enable="YES"
Textfile Collector Directory
/var/db/node_exporter/textfile_collector/
All custom metrics are written here as *.prom files and scraped by node_exporter.
Collectors (node_exporter textfile)
All custom metrics are exported via node_exporter’s textfile collector:
Directory:
/var/db/node_exporter/textfile_collector/
prom_arc_hash_collisions.sh
Exports:
zfs_arc_hash_collisions(counter) Source:sysctl kstat.zfs.misc.arcstats.hash_collisions
Script:
#!/bin/sh
set -eu

OUT="/var/db/node_exporter/textfile_collector/zfs_arc_hash_collisions.prom.$$"
FINAL="/var/db/node_exporter/textfile_collector/zfs_arc_hash_collisions.prom"

VAL=$(sysctl -n kstat.zfs.misc.arcstats.hash_collisions)

cat <<EOF > "$OUT"
# HELP zfs_arc_hash_collisions ARC hash table collisions (kstat.zfs.misc.arcstats.hash_collisions)
# TYPE zfs_arc_hash_collisions counter
zfs_arc_hash_collisions $VAL
EOF

mv "$OUT" "$FINAL"
prom_arc_hdr_size.sh
Exports:
zfs_arc_hdr_size_bytes(gauge) Source:sysctl kstat.zfs.misc.arcstats.hdr_size
Script:
#!/bin/sh

OUT="/var/db/node_exporter/textfile_collector/zfs_arc_hdr_size.prom.$$"
FINAL="/var/db/node_exporter/textfile_collector/zfs_arc_hdr_size.prom"

VAL=$(sysctl -n kstat.zfs.misc.arcstats.hdr_size)

cat <<EOF > "$OUT"
# HELP zfs_arc_hdr_size_bytes ZFS ARC header size (kstat.zfs.misc.arcstats.hdr_size)
# TYPE zfs_arc_hdr_size_bytes gauge
zfs_arc_hdr_size_bytes $VAL
EOF

mv "$OUT" "$FINAL"
zpool_prom.sh
Exports pool capacity/usage metrics.
zfs_jails_prom.sh
Exports per-jail ZFS dataset metrics:
zfs_jail_used_byteszfs_jail_avail_byteszfs_jail_refer_bytes
jail_mem_prom.sh
Exports per-jail memory metrics.
Cron Jobs (collector schedule)
All collectors run every minute to keep Grafana panels fresh:
* * * * * /usr/local/bin/zpool_prom.sh >/dev/null 2>&1
* * * * * /usr/local/bin/zfs_jails_prom.sh >/dev/null 2>&1
* * * * * /usr/local/bin/jail_mem_prom.sh >/dev/null 2>&1
* * * * * /usr/local/bin/prom_arc_hash_collisions.sh >/dev/null 2>&1
* * * * * /usr/local/bin/prom_arc_hdr_size.sh >/dev/null 2>&1
Notes:
- Output is suppressed to avoid cron mail spam.
- Textfile writes use atomic temp files + mv to avoid partial reads by node_exporter.
Grafana Panels (FreeBSD-compatible)
Screenshots will be added here for each panel.


ARC Size (% of Max)
100 *
(
  max by (instance) (node_zfs_arcstats_size_bytes{instance="$Host"})
/
  max by (instance) (node_zfs_arcstats_c_max_bytes{instance="$Host"})
)
ARC Hash Collisions (rate)
rate(zfs_arc_hash_collisions{instance="$Host"}[$__rate_interval])
ARC Header Size
zfs_arc_hdr_size_bytes{instance="$Host"}
Panel notes:
- Units must match the expression (percent for ARC %, bytes for hdr_size).
$Hostmust resolve to the fullinstancelabel including port (e.g.,10.10.0.1:9100).
Panels Removed / Hidden (Not Applicable on FreeBSD)
Imported Linux-oriented panels referenced non-existent series such as:
sysctl_kstat_zfs_misc_arcstats_*- L2ARC metrics when no L2ARC device exists
Action taken:
- These panels were hidden or removed.
- Equivalent FreeBSD-valid metrics were implemented via textfile collectors.
Verification
fetch -o - http://localhost:9100/metrics | grep zfs_arc
Expected:
zfs_arc_hash_collisions 787093
zfs_arc_hdr_size_bytes 11108160
Lessons Learned
- Imported dashboards often assume Linux exporters; FreeBSD requires explicit validation of every metric name.
- node_exporter’s textfile collector is the cleanest way to bridge missing kernel metrics without writing a custom exporter.
- Panel units matter: percentages must be displayed as percent, not bytes.
- Hiding invalid panels is better than leaving misleading “No data” tiles in production dashboards.
Next Steps
- Add alerting on ARC hash collision rate spikes.
- Track ARC header size trends over time to correlate with metadata-heavy workloads.
- Consider L2ARC panels only if an L2 device is later deployed.