Monitoring TrueNAS SCALE with Grafana
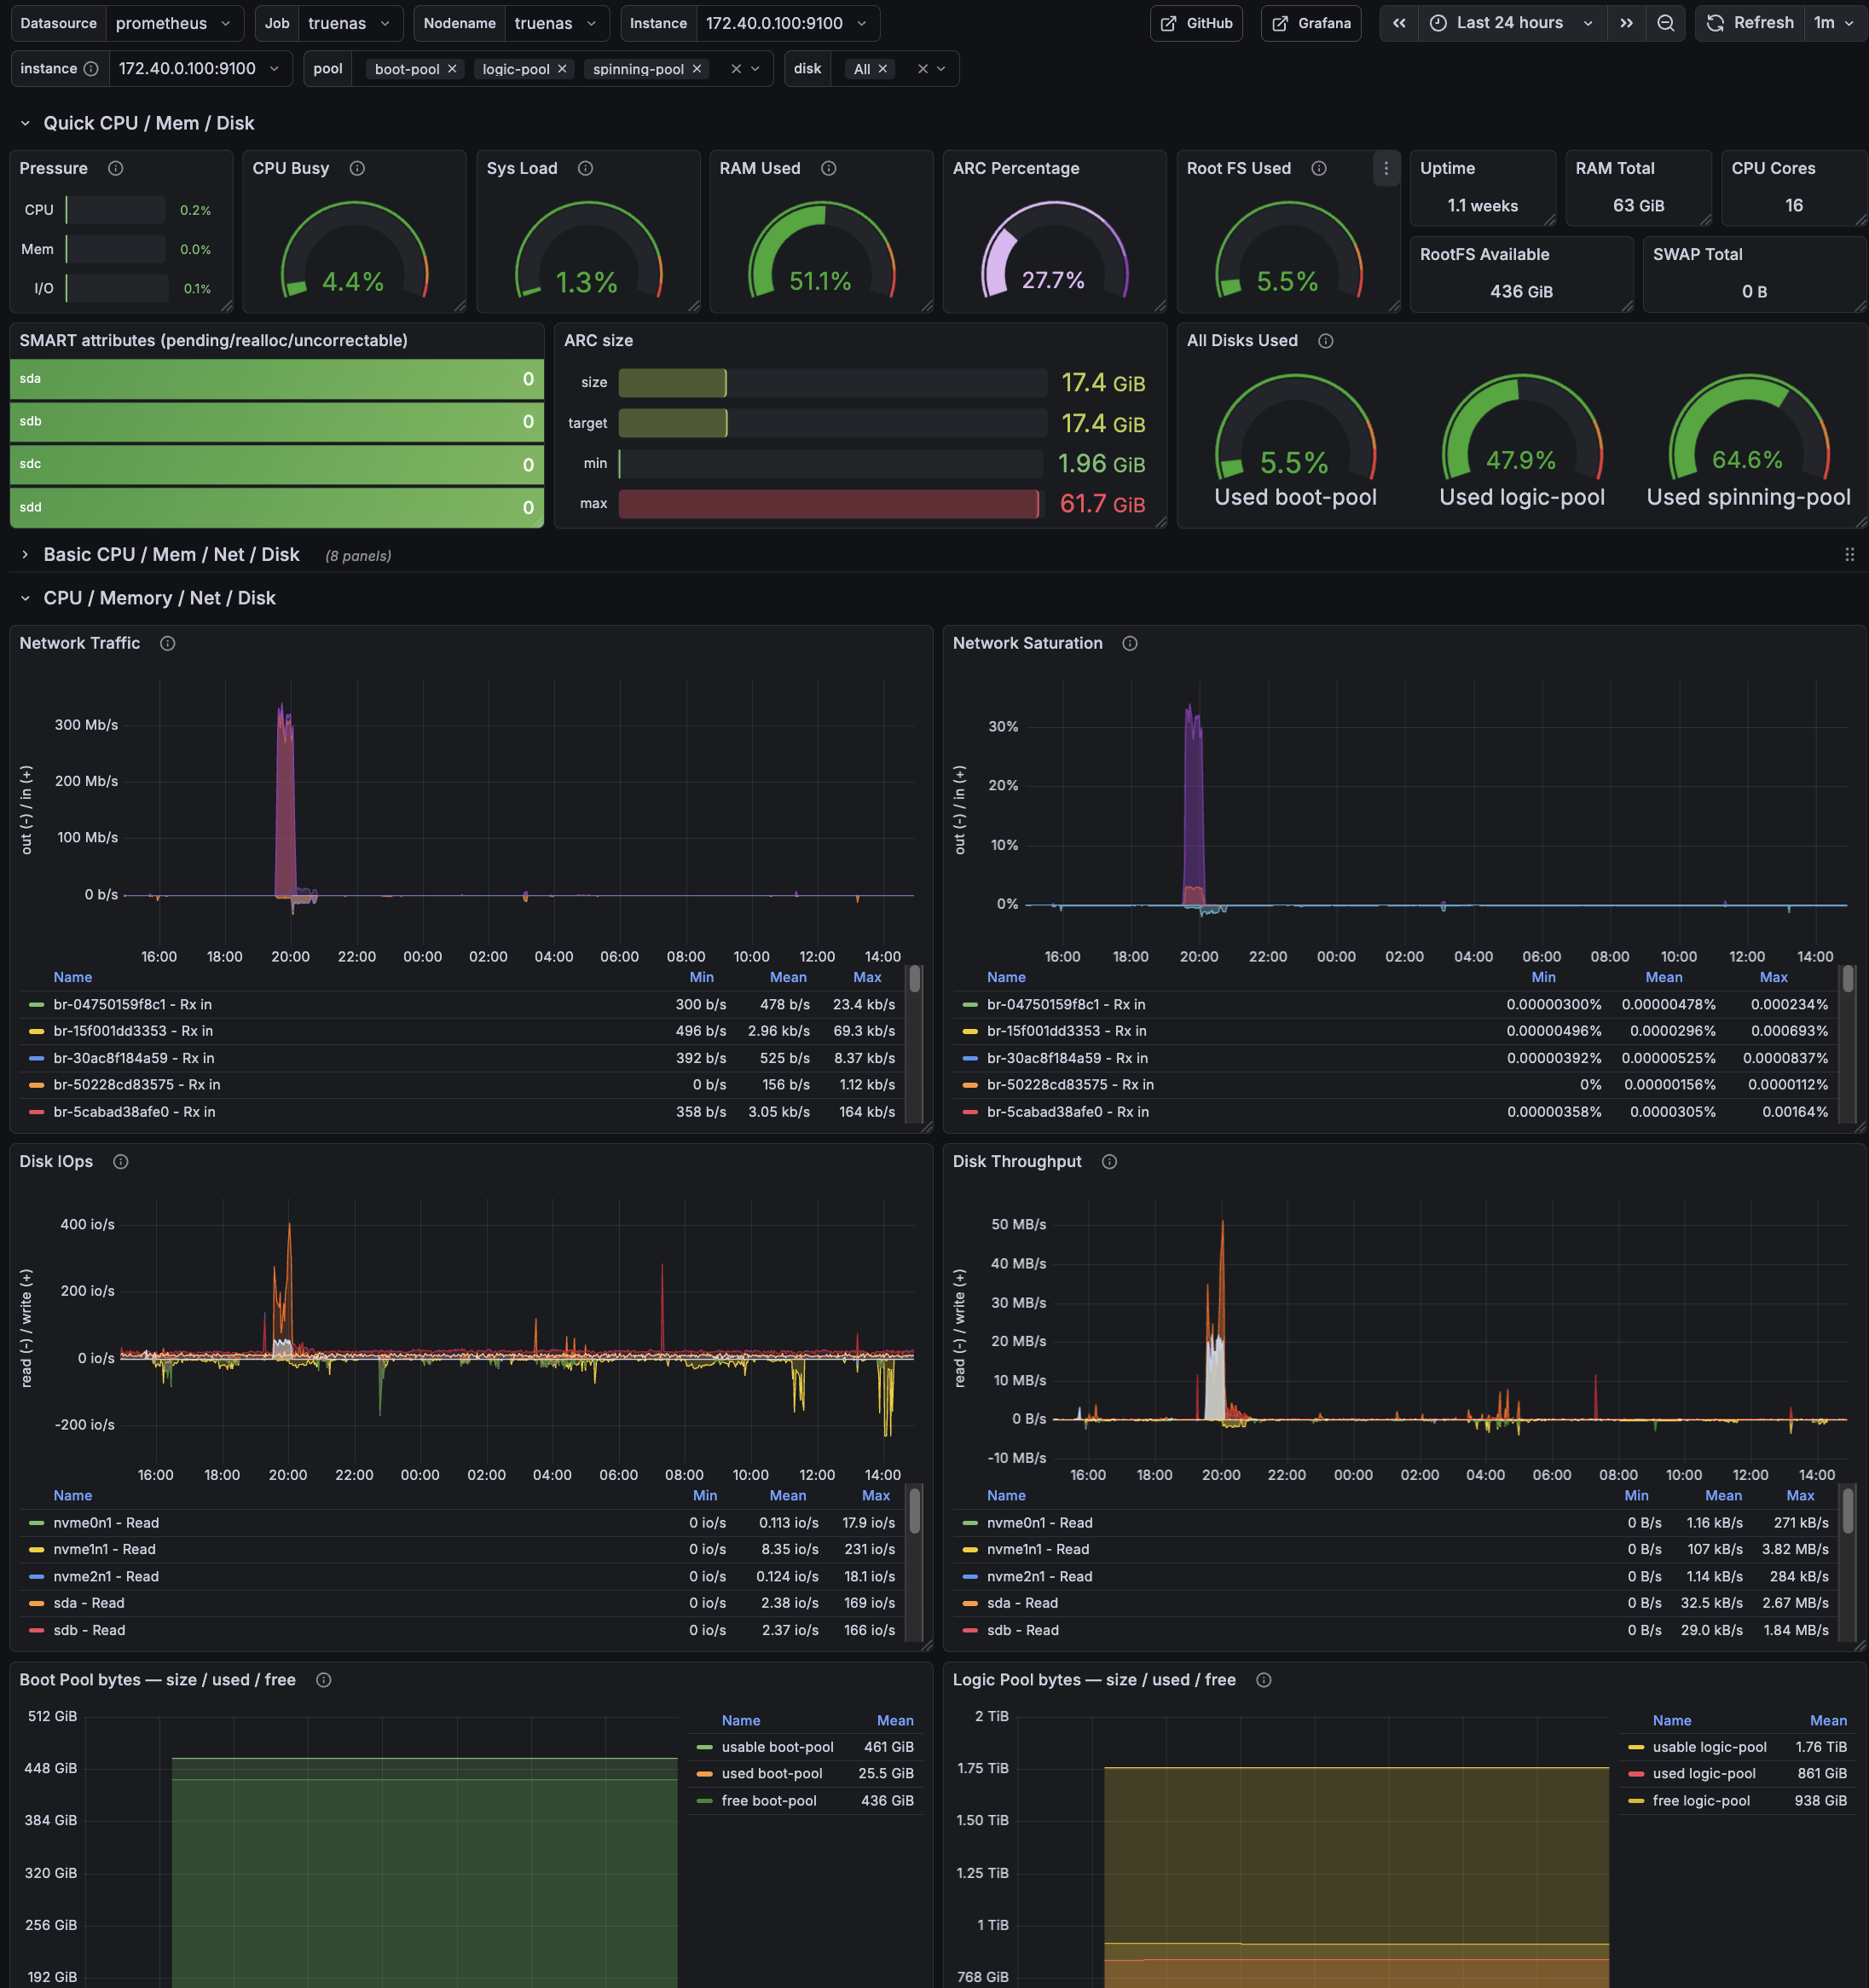
Grafana overview dashboard for TrueNAS SCALE: CPU/load, memory + ARC, ZFS pool usage, SMART status, and network/disk activity at a glance.
Grafana overview dashboard for TrueNAS SCALE: CPU/load, memory + ARC, ZFS pool usage, SMART status, and network/disk activity at a glance.
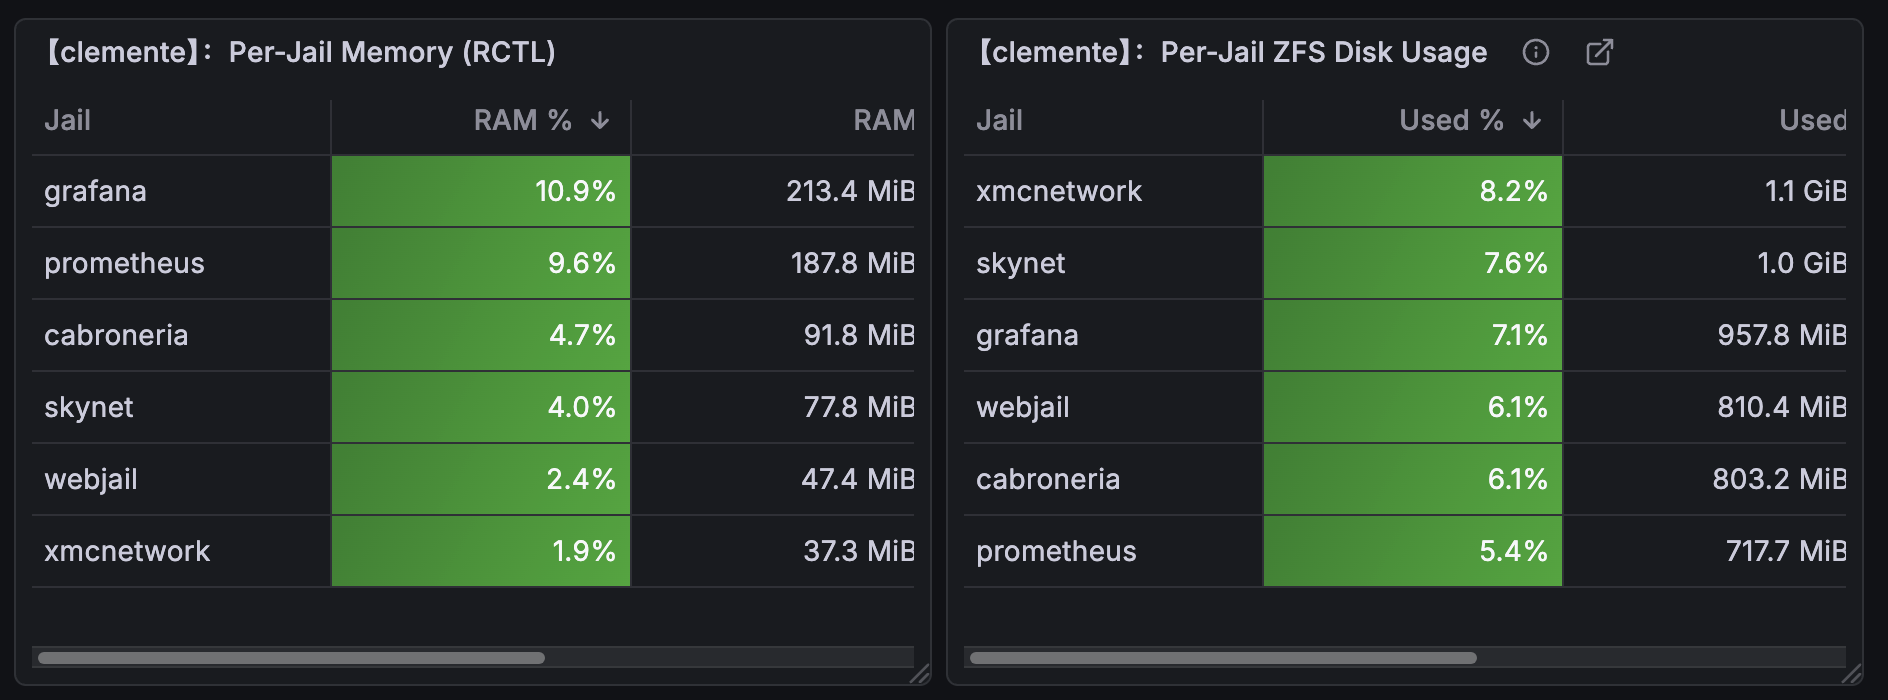
Date: 2026-02-11 per-jail RAM, VMEM, and swap metrics in Prometheus/Grafana.
Host: FreeBSD jail host
Component: RACCT/RCTL + node_exporter textfile collector
Outcome: Per-jail RAM/VMEM/SWAP metrics in Prometheus/Grafana
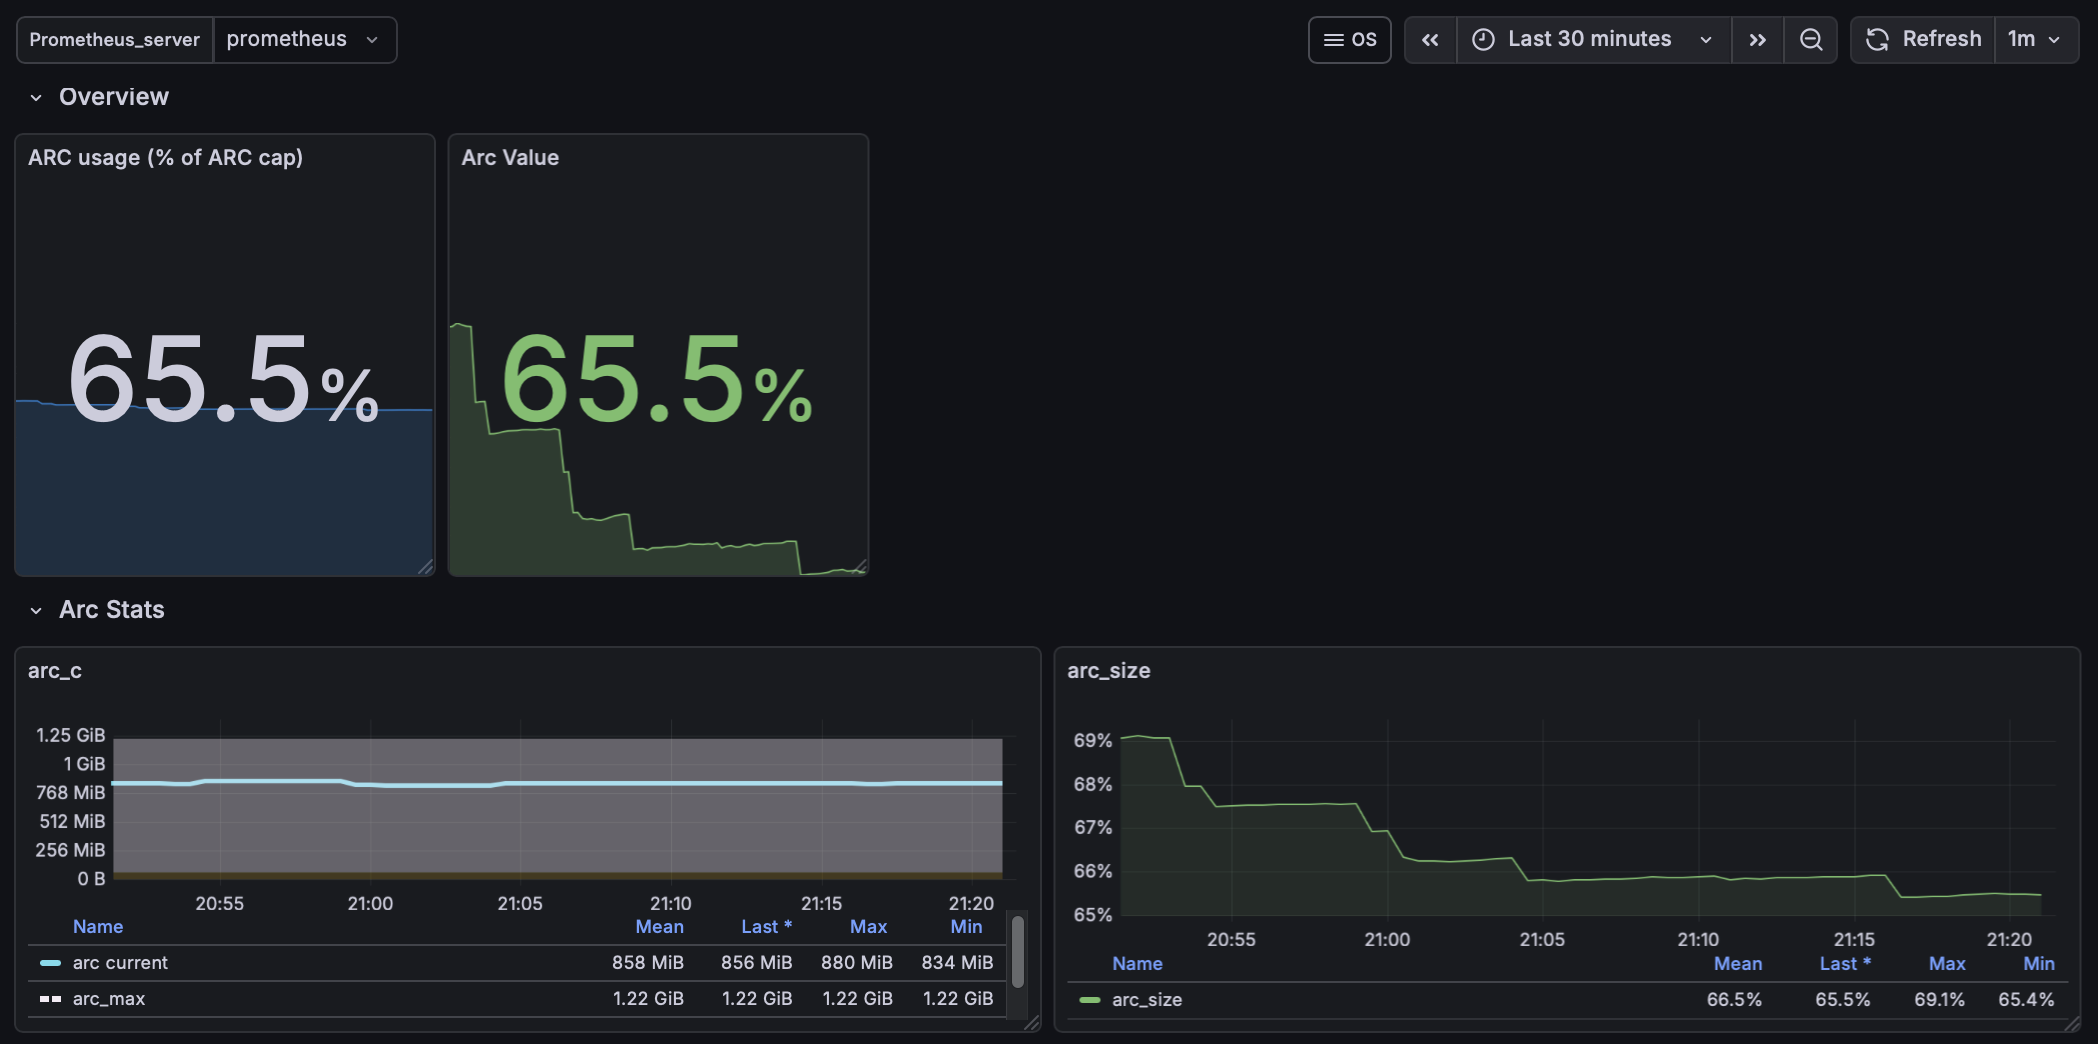
Steps taken to make an imported ZFS/Grafana dashboard work correctly on FreeBSD. Panels assumed Linux exporters and referenced metrics that do not exist on FreeBSD. The result was a dashboard full of empty panels. This walkthrough shows how the missing ARC kstats where identified, cleanly exported and refactored so that the panels reflect the real FreeBSD kernel state.
Host: clemente (10.10.0.1)
Stack: FreeBSD + node_exporter (textfile collector) + Prometheus + Grafana
Date: 2026-02-10
FreeBSD ZFS Grafana Panel.
Date: 2026-02-08
Host: grafana
Component: Prometheus + Grafana + exporters +zfs
Scope: ZFS monitoring
This guide sets up zpool capacity metrics (zpool list) for Prometheus/Grafana using
node-exporter’s textfile collector on FreeBSD.
This complements (not replaces) zfs_exporter, which provides ARC/internal ZFS metrics but not pool capacity.
Metrics exposed to Prometheus:
zpool_size_bytes{pool="zroot"}zpool_alloc_bytes{pool="zroot"}zpool_free_bytes{pool="zroot"}zpool_capacity_ratio{pool="zroot"}These map directly to:
…Date: 2026-02-08
Host: grafana
Component: Prometheus + Grafana + exporters
Scope: DNS monitoring
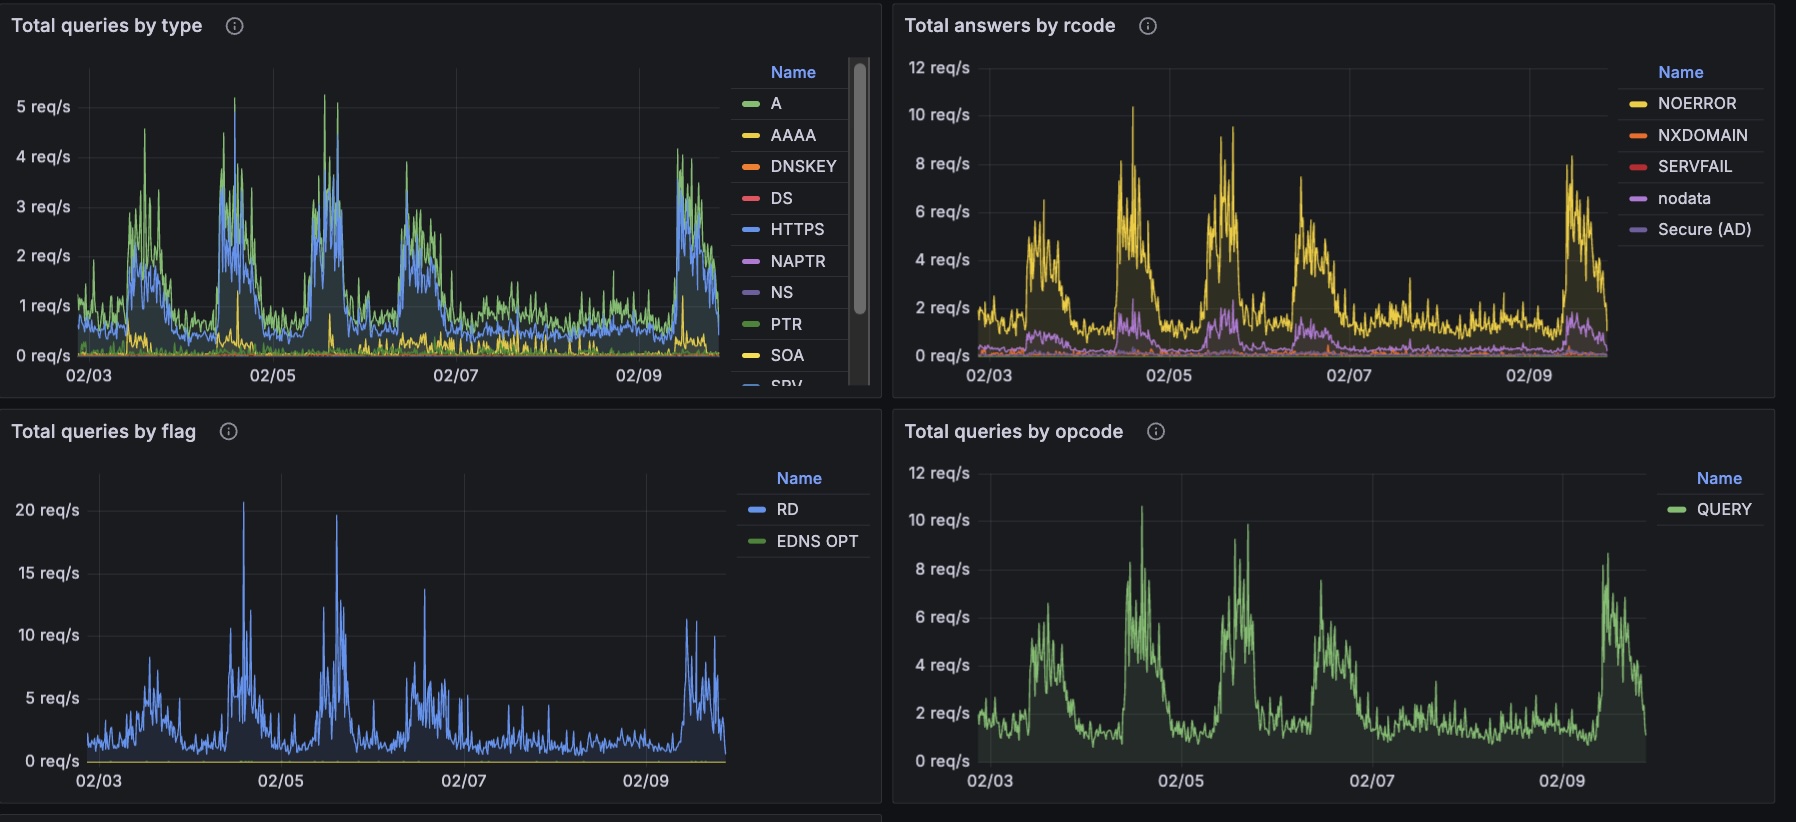
Monitoring DNS with Grafana
Date: 2026-02-08
Host: GhostBSD
Component: Ungoogled-Chrome
Note 2025-11-02 23:04:26
This document packages everything needed to install, back up, restore, and run Ungoogled Chromium inside a Bastille jail named chromey
in the JailFox style and more. After going through the process you have a jailed ungoogle-chromium with full video and audio support, emojis and fonts etc.
Just in case the chicken came before the egg, the process starts with a robust Home backup/restore flow so your profile/configs survive rebuilds. Then it walks through the templates, scripts, mounts, X11 fixes, and the launchers.
…This guide walks you through the process of setting up Unbound, a validating, recursive, and caching DNS resolver, on your Mac using MacPorts. The primary goal is to create a DNS sinkhole, which is a security mechanism used to intercept and block malicious traffic. By configuring Unbound on your Mac, you can improve your network security, enhance privacy by using DNS over TLS, and block unwanted ads and trackers.
…Date: 2026-02-08
Host: macOS (MacPorts prefix: /opt/local)
Component: doas (MacPorts)
My WireGuard client app failed to load profiles because the code path relies on doas for privilege escalation. This fix corrects the macOS (MacPorts) doas installation so the client can elevate properly.
doas: not installed setuid
…and exiting with status 1.
On macOS, MacPorts installs doas without the setuid bit by default.
Because doas is not setuid-root, it cannot elevate privileges. Any command relying on it will immediately fail, including:
Date: 2026-02-08
Host: server (macOS Monterey; Homebrew prefix: /usr/local)
Grafana install: Homebrew (/usr/local/opt/grafana)
Grafana data: /usr/local/var/lib/grafana
brew services and you needed it to start at boot without any desktop login./Library/LaunchDaemons/... that runs at boot as your user.Grafana can be pointed at different data directories. In this setup, the running Brew Grafana server uses:
…