Monitoring TrueNAS SCALE with Grafana
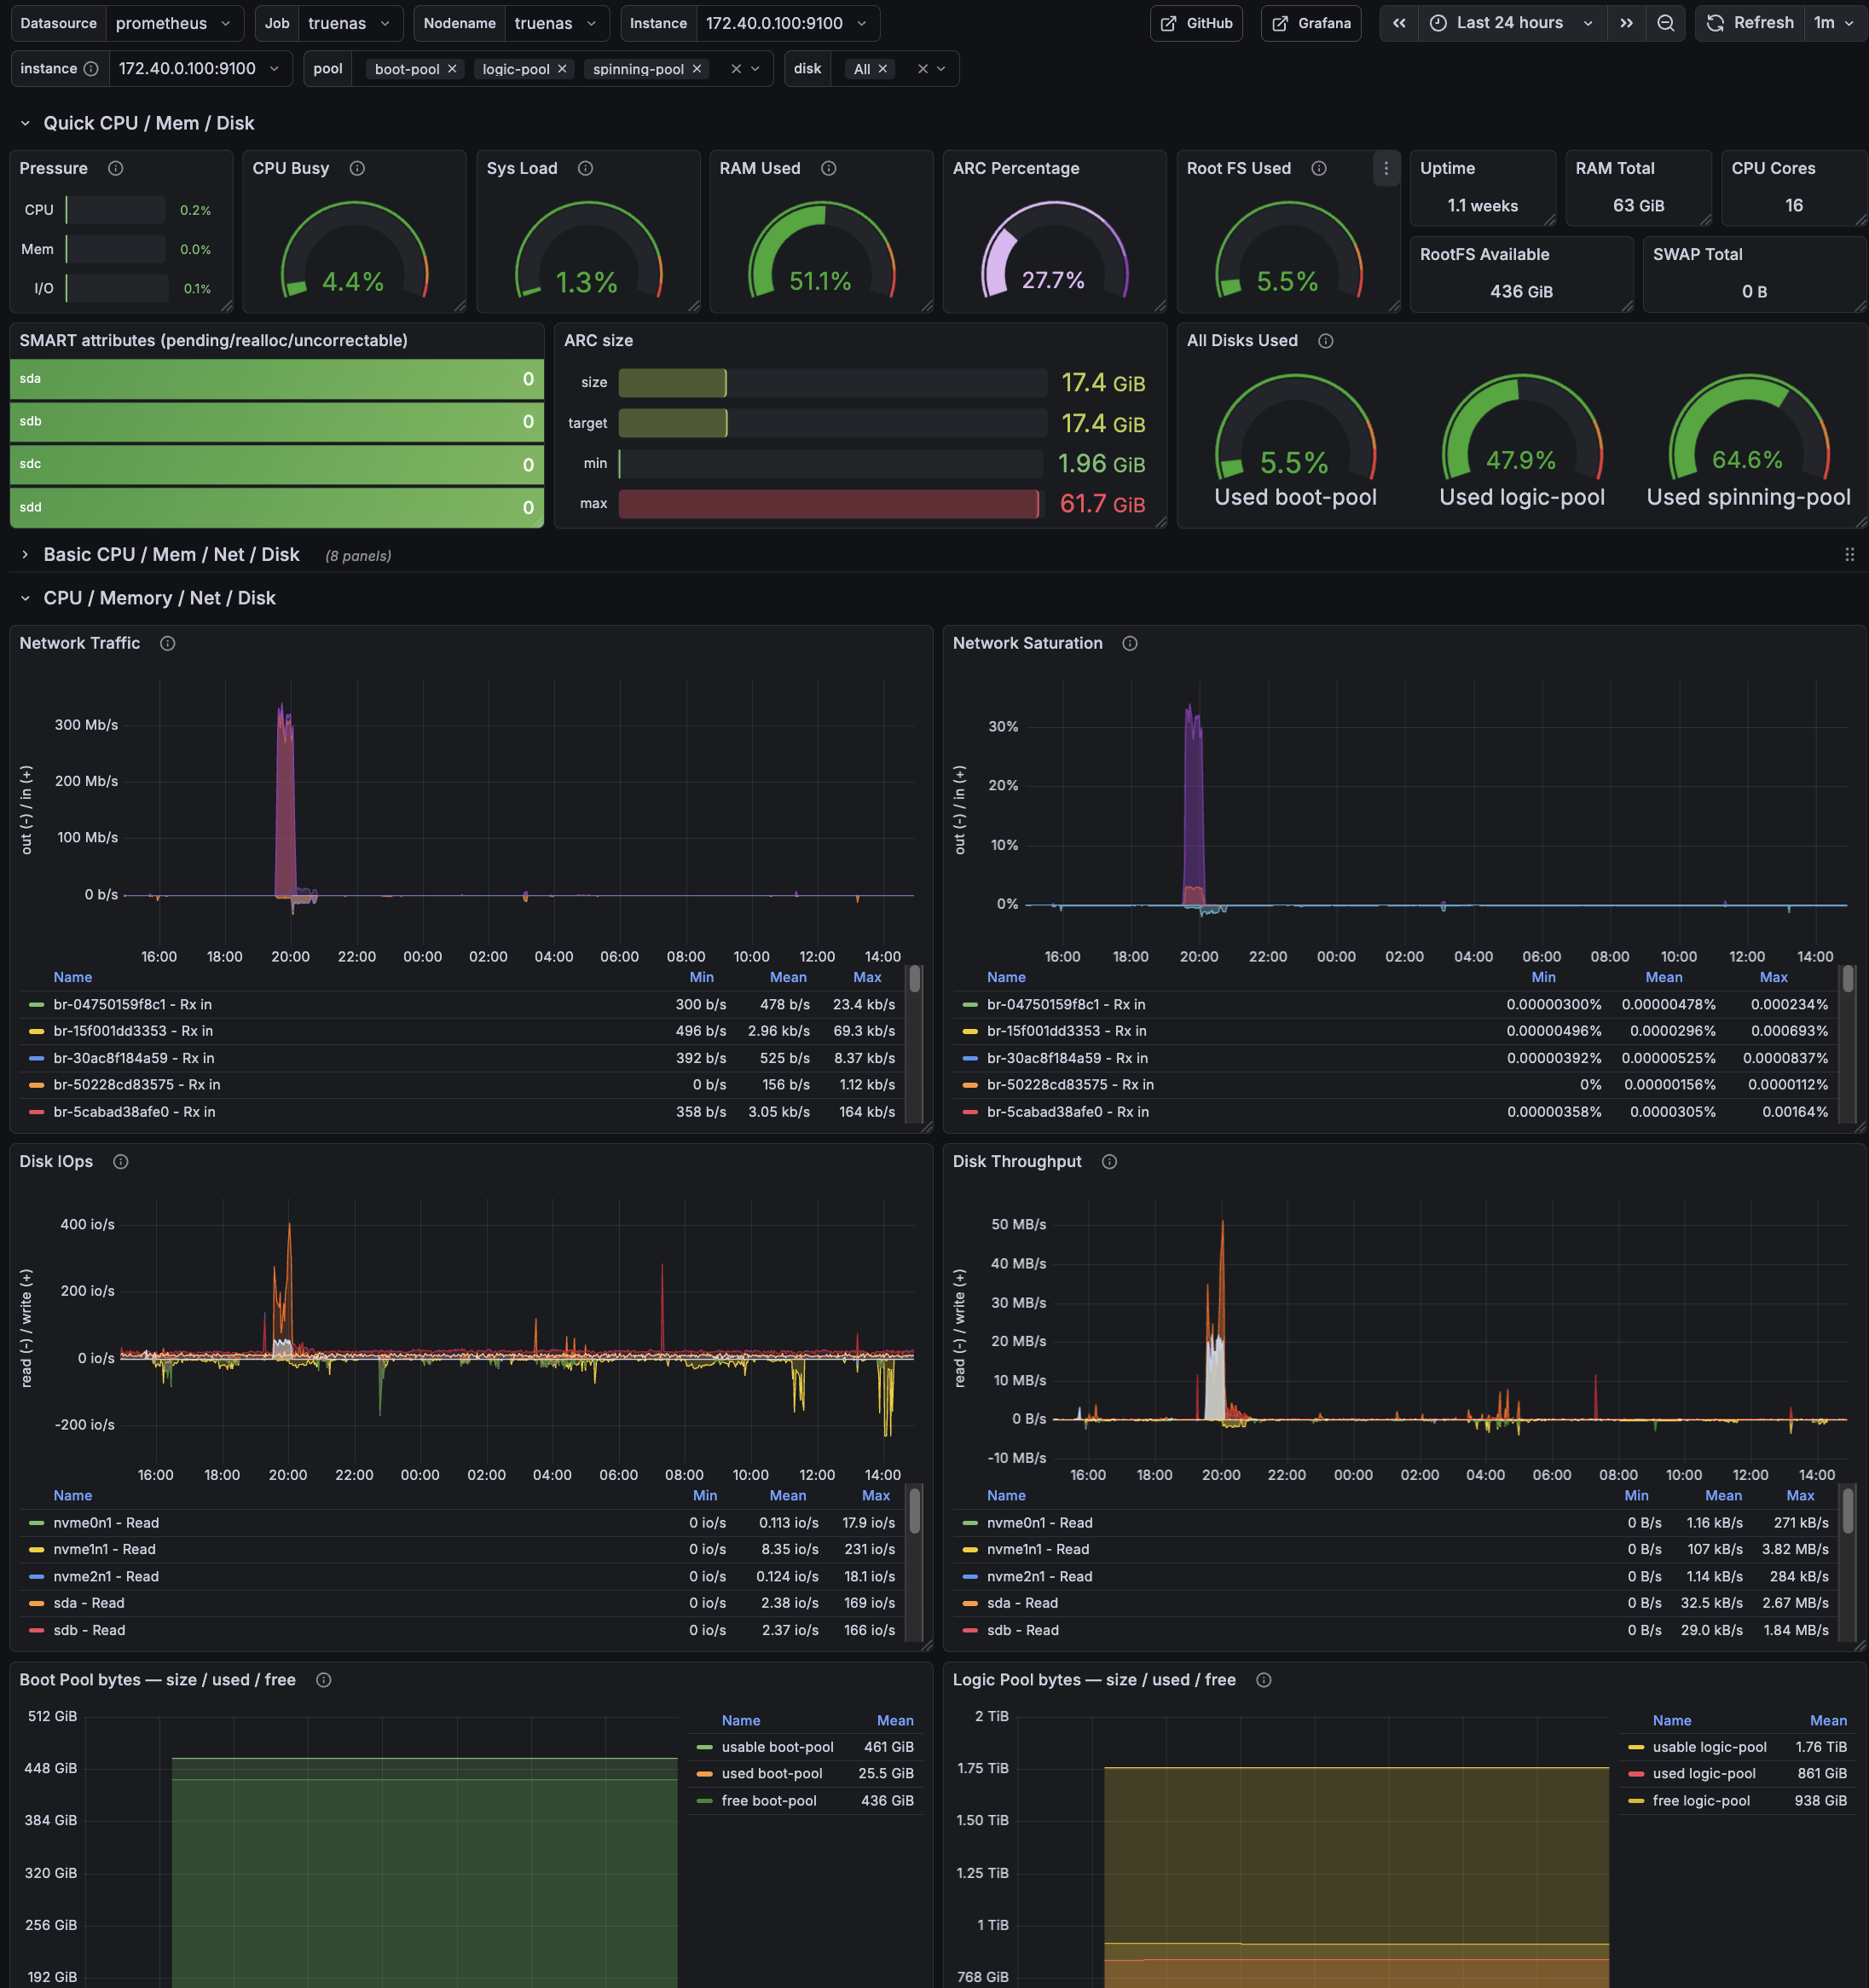
Grafana overview dashboard for TrueNAS SCALE: CPU/load, memory + ARC, ZFS pool usage, SMART status, and network/disk activity at a glance.
Monitoring TrueNAS SCALE with Graphite > Prometheus > Grafana (Full HOWTO)
This is a complete, working HOWTO for exporting metrics from TrueNAS SCALE into a Prometheus jail on FreeBSD, then visualizing them in Grafana.
I used The Goldfish Brain for a lot of the troubleshooting
Pipeline:
TrueNAS SCALE
→ Graphite (plaintext over TCP)
→ graphite-exporter (Prometheus format)
→ Prometheus (FreeBSD jail)
→ Grafana (FreeBSD jail)
I ended up with:
- Node metrics (CPU, RAM, FS, network) via node-exporter
- ZFS pool size/used/free/capacity/health
- ZFS pool IO (bytes/sec + IOPS)
- ARC size/target/min/max + hit ratio
- SMART disk health (pending/realloc/uncorrectable)
Prereqs and assumptions
This doc assumes:
- TrueNAS SCALE Docker apps/containers and SSH into the SCALE host.
- A reachable IP for SCALE from your Prometheus jail (replace placeholders below).
- These binaries are available on SCALE (either in PATH for interactive shells and cron, or referenced by absolute path):
zpoolzfssmartctl(smartmontools)nc(netcat)bash
Quick checks on SCALE:
command -v zpool zfs smartctl nc bash
zpool --version || true
smartctl -V || true
nc -h 2>&1 | head -n 2 || true
Network / ports
9100/tcp(node-exporter) and9108/tcp(graphite-exporter Prom scrape) reachable from Prometheus.9109/tcp(graphite plaintext ingest) only needs to be reachable from the SCALE host (localhost if you keep the push script local).
Netcat compatibility note
Netcat flags differ between Linux and FreeBSD (there is no single “standard” nc):
-
Linux (OpenBSD nc; common on Debian/Ubuntu/Alpine containers): use
-Nto close the socket after stdin. Graphite plaintext ingestion relies on the TCP close to flush metrics.nc -w 2 -N <HOST> <PORT> -
FreeBSD (base system nc):
-Nis not supported. Use-q 0(quit immediately after EOF).nc -w 2 -q 0 <HOST> <PORT> -
BusyBox / minimal nc builds: flags vary; some builds support neither
-Nnor-q. Fall back to a timeout and EOF:nc -w 2 <HOST> <PORT>
Graphite-exporter finalizes a plaintext metric line when the TCP connection closes. If your nc variant doesn’t close on EOF, metrics may appear to be sent but never ingested.
In this guide: the push script runs on TrueNAS SCALE (Linux), so -N is correct there. Validation commands run in the FreeBSD Prometheus jail, so use -q 0 when testing from the jail.
Architecture
TrueNAS SCALE host
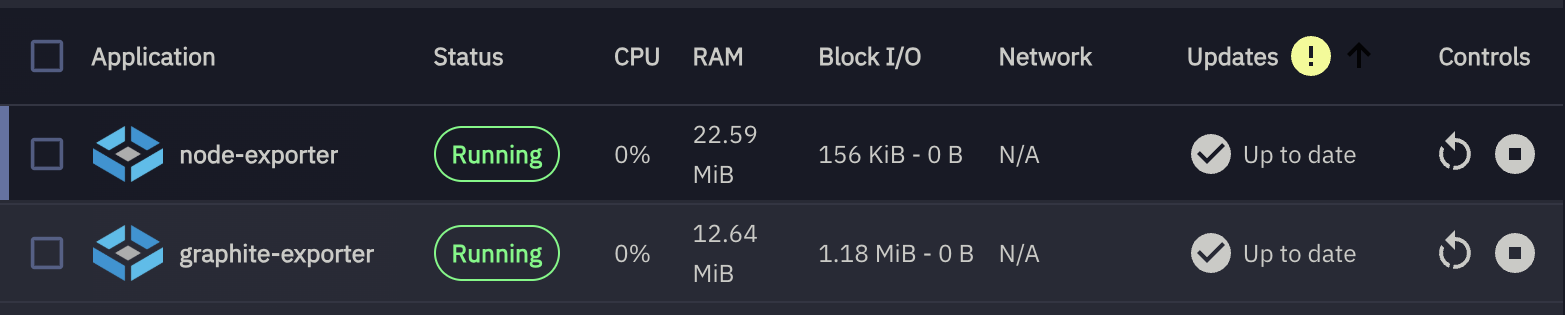
- Docker container:
node-exporter - Docker container:
graphite-exporter - Local script:
push_metrics.sh(pushes Graphite plaintext into graphite-exporter)
FreeBSD Prometheus jail
- Prometheus scrapes graphite-exporter
- Grafana queries Prometheus
1) Containers on TrueNAS SCALE
manually created containers
node-exporter container (host metrics)
Create a Docker app/container on TrueNAS SCALE:
Image:
quay.io/prometheus/node-exporter:v1.7.0
Version: v1.7.0
Ports:
9100:9100
Volumes:
These host paths are mounted read-only into the container to expose system metrics safely:
| # | Host Path | Mount Path | Mode | Purpose |
|---|---|---|---|---|
| 1 | /proc |
/host/proc |
RO | Process and kernel metrics |
| 2 | /sys |
/host/sys |
RO | Kernel, devices, and cgroup info |
| 3 | /var |
/host/var |
RO | Host state and runtime data |
| 4 | / (rootfs) |
/host/root |
RO | Root filesystem visibility |
Container Commands:
These flags tell node_exporter where to find host filesystems inside the container and which mounts to ignore.
--path.procfs=/host/proc
--path.sysfs=/host/sys
--path.rootfs=/host/root
--collector.filesystem.mount-points-exclude=^/(dev|proc|sys|run|var/lib/docker|var/lib/containerd)($|/)
Verify:
curl http://<TRUENAS_IP>:9100/metrics | head
graphite-exporter container
Image:
prom/graphite-exporter:v0.16.0
Ports:
9109:9109   # Graphite plaintext ingest
9108:9108   # Prometheus scrape endpoint
Volume:
Host Path (Path that already exists on the system)
- Mount Path
/etc/graphite-exporter - Host Path
/mnt/logic-pool/AppConfigs/graphite-exporter-config
Command:
--graphite.mapping-config=/etc/graphite-exporter/mapping.yml
Notes:
- Pin a graphite-exporter version so the mapping behavior is stable. If you intentionally want
latest, keep it — but expect occasional breaking changes. - After editing
mapping.yml, restart the graphite-exporter container so the mapping reloads.
Verify:
nc -w 2 <TRUENAS_IP> 9109
curl http://<TRUENAS_IP>:9108/metrics
2) graphite-exporter mapping.yml
Create:
/mnt/logic-pool/APP_Configs/truenas-scale-grafana-dashboard/mapping.yml
mappings:
  # -------------------------------------------------------------------
  # ZFS Pool IO (explicit names; keeps the metric names stable)
  #
  # Matches:
  #   truenas.scale.zfs.pool.<pool>.read_bytes_per_sec
  #   truenas.scale.zfs.pool.<pool>.write_bytes_per_sec
  #   truenas.scale.zfs.pool.<pool>.read_iops
  #   truenas.scale.zfs.pool.<pool>.write_iops
  # -------------------------------------------------------------------
  - match: "truenas.scale.zfs.pool.*.read_bytes_per_sec"
    match_type: glob
    name: "truenas_zfs_pool_read_bytes_per_sec"
    labels:
      pool: "${1}"

  - match: "truenas.scale.zfs.pool.*.write_bytes_per_sec"
    match_type: glob
    name: "truenas_zfs_pool_write_bytes_per_sec"
    labels:
      pool: "${1}"

  - match: "truenas.scale.zfs.pool.*.read_iops"
    match_type: glob
    name: "truenas_zfs_pool_read_iops"
    labels:
      pool: "${1}"

  - match: "truenas.scale.zfs.pool.*.write_iops"
    match_type: glob
    name: "truenas_zfs_pool_write_iops"
    labels:
      pool: "${1}"

  # -------------------------------------------------------------------
  # ZFS Pools (size/used/free/health/capacity)
  #
  # Matches: truenas.scale.zfs.pool.<pool>.<metric>
  # Exposes: truenas_zfs_pool_<metric>{pool="<pool>"}
  #
  # NOTE: keep this AFTER the explicit IO rules above.
  # -------------------------------------------------------------------
  - match: "truenas.scale.zfs.pool.*.*"
    match_type: glob
    name: "truenas_zfs_pool_${2}"
    labels:
      pool: "${1}"

  # -------------------------------------------------------------------
  # ZFS ARC (mapped to stable, readable Prometheus metric names)
  # -------------------------------------------------------------------
  - match: "truenas.scale.zfs.arc.size_bytes"
    match_type: glob
    name: "truenas_zfs_arc_size_bytes"

  - match: "truenas.scale.zfs.arc.target_bytes"
    match_type: glob
    name: "truenas_zfs_arc_target_bytes"

  - match: "truenas.scale.zfs.arc.min_bytes"
    match_type: glob
    name: "truenas_zfs_arc_min_bytes"

  - match: "truenas.scale.zfs.arc.max_bytes"
    match_type: glob
    name: "truenas_zfs_arc_max_bytes"

  - match: "truenas.scale.zfs.arc.hits_total"
    match_type: glob
    name: "truenas_zfs_arc_hits_total"

  - match: "truenas.scale.zfs.arc.misses_total"
    match_type: glob
    name: "truenas_zfs_arc_misses_total"

  # -------------------------------------------------------------------
  # SMART attributes
  #
  # Matches: truenas.scale.smart.disk.<disk>.<attr>
  # Exposes: truenas_smart_attribute_<attr>{disk="<disk>"}
  # -------------------------------------------------------------------
  - match: "truenas.scale.smart.disk.*.*"
    match_type: glob
    name: "truenas_smart_attribute_${2}"
    labels:
      disk: "${1}"
Restart graphite-exporter after editing.
3) push_metrics.sh (TrueNAS SCALE)
Before you rely on cron, run these once on SCALE to avoid “works in SSH, fails in cron” surprises:
zpool list -H -o name
smartctl -A /dev/sda 2>/dev/null | head || true
nc -w 2 127.0.0.1 9109 </dev/null || true
Create:
/mnt/logic-pool/APP_Configs/truenas-scale-grafana-dashboard/push_metrics.sh
Make executable:
chmod +x push_metrics.sh
Script (working version):
#!/bin/bash
set -euo pipefail

# Force safe locale (kills the LC_ALL warning everywhere, incl cron)
export LANG=C
export LC_ALL=C

GRAPHITE_HOST="${GRAPHITE_HOST:-127.0.0.1}"
GRAPHITE_PORT="${GRAPHITE_PORT:-9109}"
TS="$(date +%s)"

OUT=""

unit_to_bytes() {
  local num unit
  num=$(echo "$1" | grep -oE '[0-9.]+' )
  unit=$(echo "$1" | grep -oE '[A-Za-z]+')
  case "$unit" in
    B)    awk -v n="$num" 'BEGIN{printf "%.0f", n}' ;;
    K|KB) awk -v n="$num" 'BEGIN{printf "%.0f", n*1024}' ;;
    M|MB) awk -v n="$num" 'BEGIN{printf "%.0f", n*1024^2}' ;;
    G|GB) awk -v n="$num" 'BEGIN{printf "%.0f", n*1024^3}' ;;
    T|TB) awk -v n="$num" 'BEGIN{printf "%.0f", n*1024^4}' ;;
    P|PB) awk -v n="$num" 'BEGIN{printf "%.0f", n*1024^5}' ;;
    *) echo "0" ;;
  esac
}

# Add ZFS pool dataset properties as metrics (zfs get used/available/logical*)
emit_zfs_pool_zfsprops_metrics() {
  # Emits ZFS *pool dataset* properties so Grafana can match:
  #   zfs get -Hp -o value used,available,logicalused,logicalreferenced <pool>
  #
  # Graphite keys emitted:
  #   truenas.scale.zfs.pool.<pool>.zfs_used_bytes
  #   truenas.scale.zfs.pool.<pool>.zfs_available_bytes
  #   truenas.scale.zfs.pool.<pool>.zfs_usable_bytes          (used + available)
  #   truenas.scale.zfs.pool.<pool>.zfs_logicalused_bytes
  #   truenas.scale.zfs.pool.<pool>.zfs_logicalreferenced_bytes

  local pool used avail logicalused logicalref usable

  for pool in $(zpool list -H -o name); do
    used=$(zfs get -Hp -o value used "$pool" 2>/dev/null || true)
    avail=$(zfs get -Hp -o value available "$pool" 2>/dev/null || true)
    logicalused=$(zfs get -Hp -o value logicalused "$pool" 2>/dev/null || true)
    logicalref=$(zfs get -Hp -o value logicalreferenced "$pool" 2>/dev/null || true)

    [[ "$used"  =~ ^[0-9]+$ ]] || continue
    [[ "$avail" =~ ^[0-9]+$ ]] || continue

    usable=$(( used + avail ))

    OUT+="truenas.scale.zfs.pool.${pool}.zfs_used_bytes ${used} ${TS}\\n"
    OUT+="truenas.scale.zfs.pool.${pool}.zfs_available_bytes ${avail} ${TS}\\n"
    OUT+="truenas.scale.zfs.pool.${pool}.zfs_usable_bytes ${usable} ${TS}\\n"

    [[ "$logicalused" =~ ^[0-9]+$ ]] && OUT+="truenas.scale.zfs.pool.${pool}.zfs_logicalused_bytes ${logicalused} ${TS}\\n"
    [[ "$logicalref"  =~ ^[0-9]+$ ]] && OUT+="truenas.scale.zfs.pool.${pool}.zfs_logicalreferenced_bytes ${logicalref} ${TS}\\n"
  done
}

# -----------------------------
# ZPOOL CAPACITY
# -----------------------------
for pool in $(zpool list -H -o name); do
  used_raw=$(zpool list -H -o allocated "$pool")
  free_raw=$(zpool list -H -o free "$pool")
  size_raw=$(zpool list -H -o size "$pool")
  capacity_percent=$(zpool list -H -o capacity "$pool" | tr -d '%')
  health=$(zpool list -H -o health "$pool")

  used=$(unit_to_bytes "$used_raw")
  free=$(unit_to_bytes "$free_raw")
  size=$(unit_to_bytes "$size_raw")

  case "$health" in
    ONLINE) health_value=1 ;;
    DEGRADED) health_value=0.5 ;;
    *) health_value=0 ;;
  esac

  OUT+="truenas.scale.zfs.pool.${pool}.used_bytes ${used} ${TS}\n"
  OUT+="truenas.scale.zfs.pool.${pool}.free_bytes ${free} ${TS}\n"
  OUT+="truenas.scale.zfs.pool.${pool}.size_bytes ${size} ${TS}\n"
  OUT+="truenas.scale.zfs.pool.${pool}.capacity_percent ${capacity_percent} ${TS}\n"
  OUT+="truenas.scale.zfs.pool.${pool}.health_status ${health_value} ${TS}\n"

done

# Add ZFS-property-based pool metrics (zfs get used/available/logical*)
emit_zfs_pool_zfsprops_metrics

# ----------------------------------------
# ZPOOL IOSTAT (bytes/sec + IOPS)
# ----------------------------------------
# We take the 2nd sample because the first sample is "since boot" averaged.
# -H = script-friendly
# -p = numeric (bytes, no K/M/G)
# -y = skip the since-boot summary
#
# NOTE: column ordering can vary by OpenZFS version; this assumes:
#   <pool> <alloc> <free> <read> <write> <read_ops> <write_ops>
zpool_iostat_out="$(zpool iostat -H -p -y 1 2 2>/dev/null | tail -n +2 || true)"
if [ -n "${zpool_iostat_out}" ]; then
  echo "${zpool_iostat_out}" | awk -v TS="$TS" '
    NF >= 7 {
      pool=$1
      read_bps=$4
      write_bps=$5
      read_iops=$6
      write_iops=$7
      printf "truenas.scale.zfs.pool.%s.read_bytes_per_sec %.0f %s\n", pool, read_bps, TS
      printf "truenas.scale.zfs.pool.%s.write_bytes_per_sec %.0f %s\n", pool, write_bps, TS
      printf "truenas.scale.zfs.pool.%s.read_iops %.0f %s\n", pool, read_iops, TS
      printf "truenas.scale.zfs.pool.%s.write_iops %.0f %s\n", pool, write_iops, TS
    }
  ' >> /tmp/truenas_zpool_iostat.$$ || true

  if [ -s /tmp/truenas_zpool_iostat.$$ ]; then
    OUT+="$(cat /tmp/truenas_zpool_iostat.$$)\n"
  fi
  rm -f /tmp/truenas_zpool_iostat.$$
fi

# ----------------------------------------
# ARC STATS (from /proc spl kstat)
# ----------------------------------------
ARCSTATS="/proc/spl/kstat/zfs/arcstats"
if [ -r "$ARCSTATS" ]; then
  arc_get() {
    awk -v key="$1" '$1==key {print $3; exit}' "$ARCSTATS"
  }

  arc_size=$(arc_get size)
  arc_target=$(arc_get c)
  arc_min=$(arc_get c_min)
  arc_max=$(arc_get c_max)
  arc_hits=$(arc_get hits)
  arc_misses=$(arc_get misses)

  [ -n "${arc_size:-}" ]   && OUT+="truenas.scale.zfs.arc.size_bytes ${arc_size} ${TS}\n"
  [ -n "${arc_target:-}" ] && OUT+="truenas.scale.zfs.arc.target_bytes ${arc_target} ${TS}\n"
  [ -n "${arc_min:-}" ]    && OUT+="truenas.scale.zfs.arc.min_bytes ${arc_min} ${TS}\n"
  [ -n "${arc_max:-}" ]    && OUT+="truenas.scale.zfs.arc.max_bytes ${arc_max} ${TS}\n"
  [ -n "${arc_hits:-}" ]   && OUT+="truenas.scale.zfs.arc.hits_total ${arc_hits} ${TS}\n"
  [ -n "${arc_misses:-}" ] && OUT+="truenas.scale.zfs.arc.misses_total ${arc_misses} ${TS}\n"
fi

# ---- SEND ONCE ----
# NOTE: Some netcat builds don't support `-N`. If this fails, use `-q 0` (if supported) or remove the flag.
printf "%b" "$OUT" | nc -w 2 -N "$GRAPHITE_HOST" "$GRAPHITE_PORT"

# -----------------------------
# SMART
# -----------------------------
for disk_path in $(ls /dev/sd* 2>/dev/null | grep -v '[0-9]' || true); do
  disk=$(basename "$disk_path")

  reallocated=$(smartctl -A "/dev/$disk" 2>/dev/null | awk '/Reallocated_Sector_Ct/ {print $10; exit}')
  pending=$(smartctl -A "/dev/$disk" 2>/dev/null | awk '/Current_Pending_Sector/ {print $10; exit}')
  uncorrectable=$(smartctl -A "/dev/$disk" 2>/dev/null | awk '/Offline_Uncorrectable/ {print $10; exit}')

  [ -n "${reallocated:-}" ]   && echo "truenas.scale.smart.disk.${disk}.reallocated_sectors $reallocated $TS"   | nc -w 2 -N "$GRAPHITE_HOST" "$GRAPHITE_PORT"
  [ -n "${pending:-}" ]       && echo "truenas.scale.smart.disk.${disk}.pending_sectors $pending $TS"           | nc -w 2 -N "$GRAPHITE_HOST" "$GRAPHITE_PORT"
  [ -n "${uncorrectable:-}" ] && echo "truenas.scale.smart.disk.${disk}.uncorrectable_sectors $uncorrectable $TS" | nc -w 2 -N "$GRAPHITE_HOST" "$GRAPHITE_PORT"

done
Run manually:
./push_metrics.sh
Verify:
curl http://127.0.0.1:9108/metrics | egrep '^truenas_(zfs_pool|zfs_arc|smart_attribute)_' | head
3b) Cron job on TrueNAS SCALE (run push_metrics.sh automatically)

TrueNAS SCALE runs scheduled tasks via its middleware cron runner, so you want an explicit command that:
- sets a safe locale (avoids
LC_ALLwarnings) - sets the graphite exporter destination (
GRAPHITE_HOST/GRAPHITE_PORT) - calls bash explicitly (so the script runs the same way under cron as it does interactively)
- discards output (or logs it somewhere useful)
Create the cron task in the UI
Go to:
System Settings → Advanced → Cron Jobs → Add
Use a schedule like every 1 minute (or 5 minutes if you prefer).
Command (working form):
env LANG=C LC_ALL=C GRAPHITE_HOST=127.0.0.1 GRAPHITE_PORT=9109 \
  /bin/bash /mnt/logic-pool/APP_Configs/truenas-scale-grafana-dashboard/push_metrics.sh \
  > /dev/null 2>&1
Notes:
- Exit status 127 usually means the command was not found (e.g., wrong
bashpath or a missing binary likenc,smartctl,zpool,zfsin cron’s PATH). The command above avoids PATH surprises by calling/bin/bashexplicitly and using absolute paths for the script. - If you want logging while debugging, replace the redirect with a logfile:
env LANG=C LC_ALL=C GRAPHITE_HOST=127.0.0.1 GRAPHITE_PORT=9109 \
  /bin/bash /mnt/logic-pool/APP_Configs/truenas-scale-grafana-dashboard/push_metrics.sh \
  >> /mnt/logic-pool/APP_Configs/truenas-scale-grafana-dashboard/push_metrics.log 2>&1
Quick cron validation
-
Run the exact command manually from an SSH shell (copy/paste it).
-
Confirm graphite-exporter is still ingesting:
ts=$(date +%s)
echo "truenas_test_simple 1 $ts" | nc -w 2 -N 127.0.0.1 9109
sleep 1
curl -s http://127.0.0.1:9108/metrics | egrep 'graphite_last_processed_timestamp_seconds|truenas_test_simple'
- Confirm your real metrics are present:
curl -s http://127.0.0.1:9108/metrics | egrep '^truenas_(zfs_pool|zfs_arc|smart_attribute)_' | head
If those commands work manually but not via cron, the cron environment is the culprit (PATH, permissions, or missing binaries). Using the explicit env ... /bin/bash ... command above fixes the common cases.
4) Prometheus jail (FreeBSD)
Replace 172.40.0.100 with your TrueNAS SCALE IP (or DNS name) reachable from the jail. The jail must be able to route to the SCALE host on the exposed ports.
/usr/local/etc/prometheus.yml
global:
  scrape_interval: 15s

scrape_configs:
  - job_name: "truenas-node"
    static_configs:
      - targets: ["172.40.0.100:9100"]

  - job_name: "truenas-graphite"
    static_configs:
      - targets: ["172.40.0.100:9108"]
Restart Prometheus.
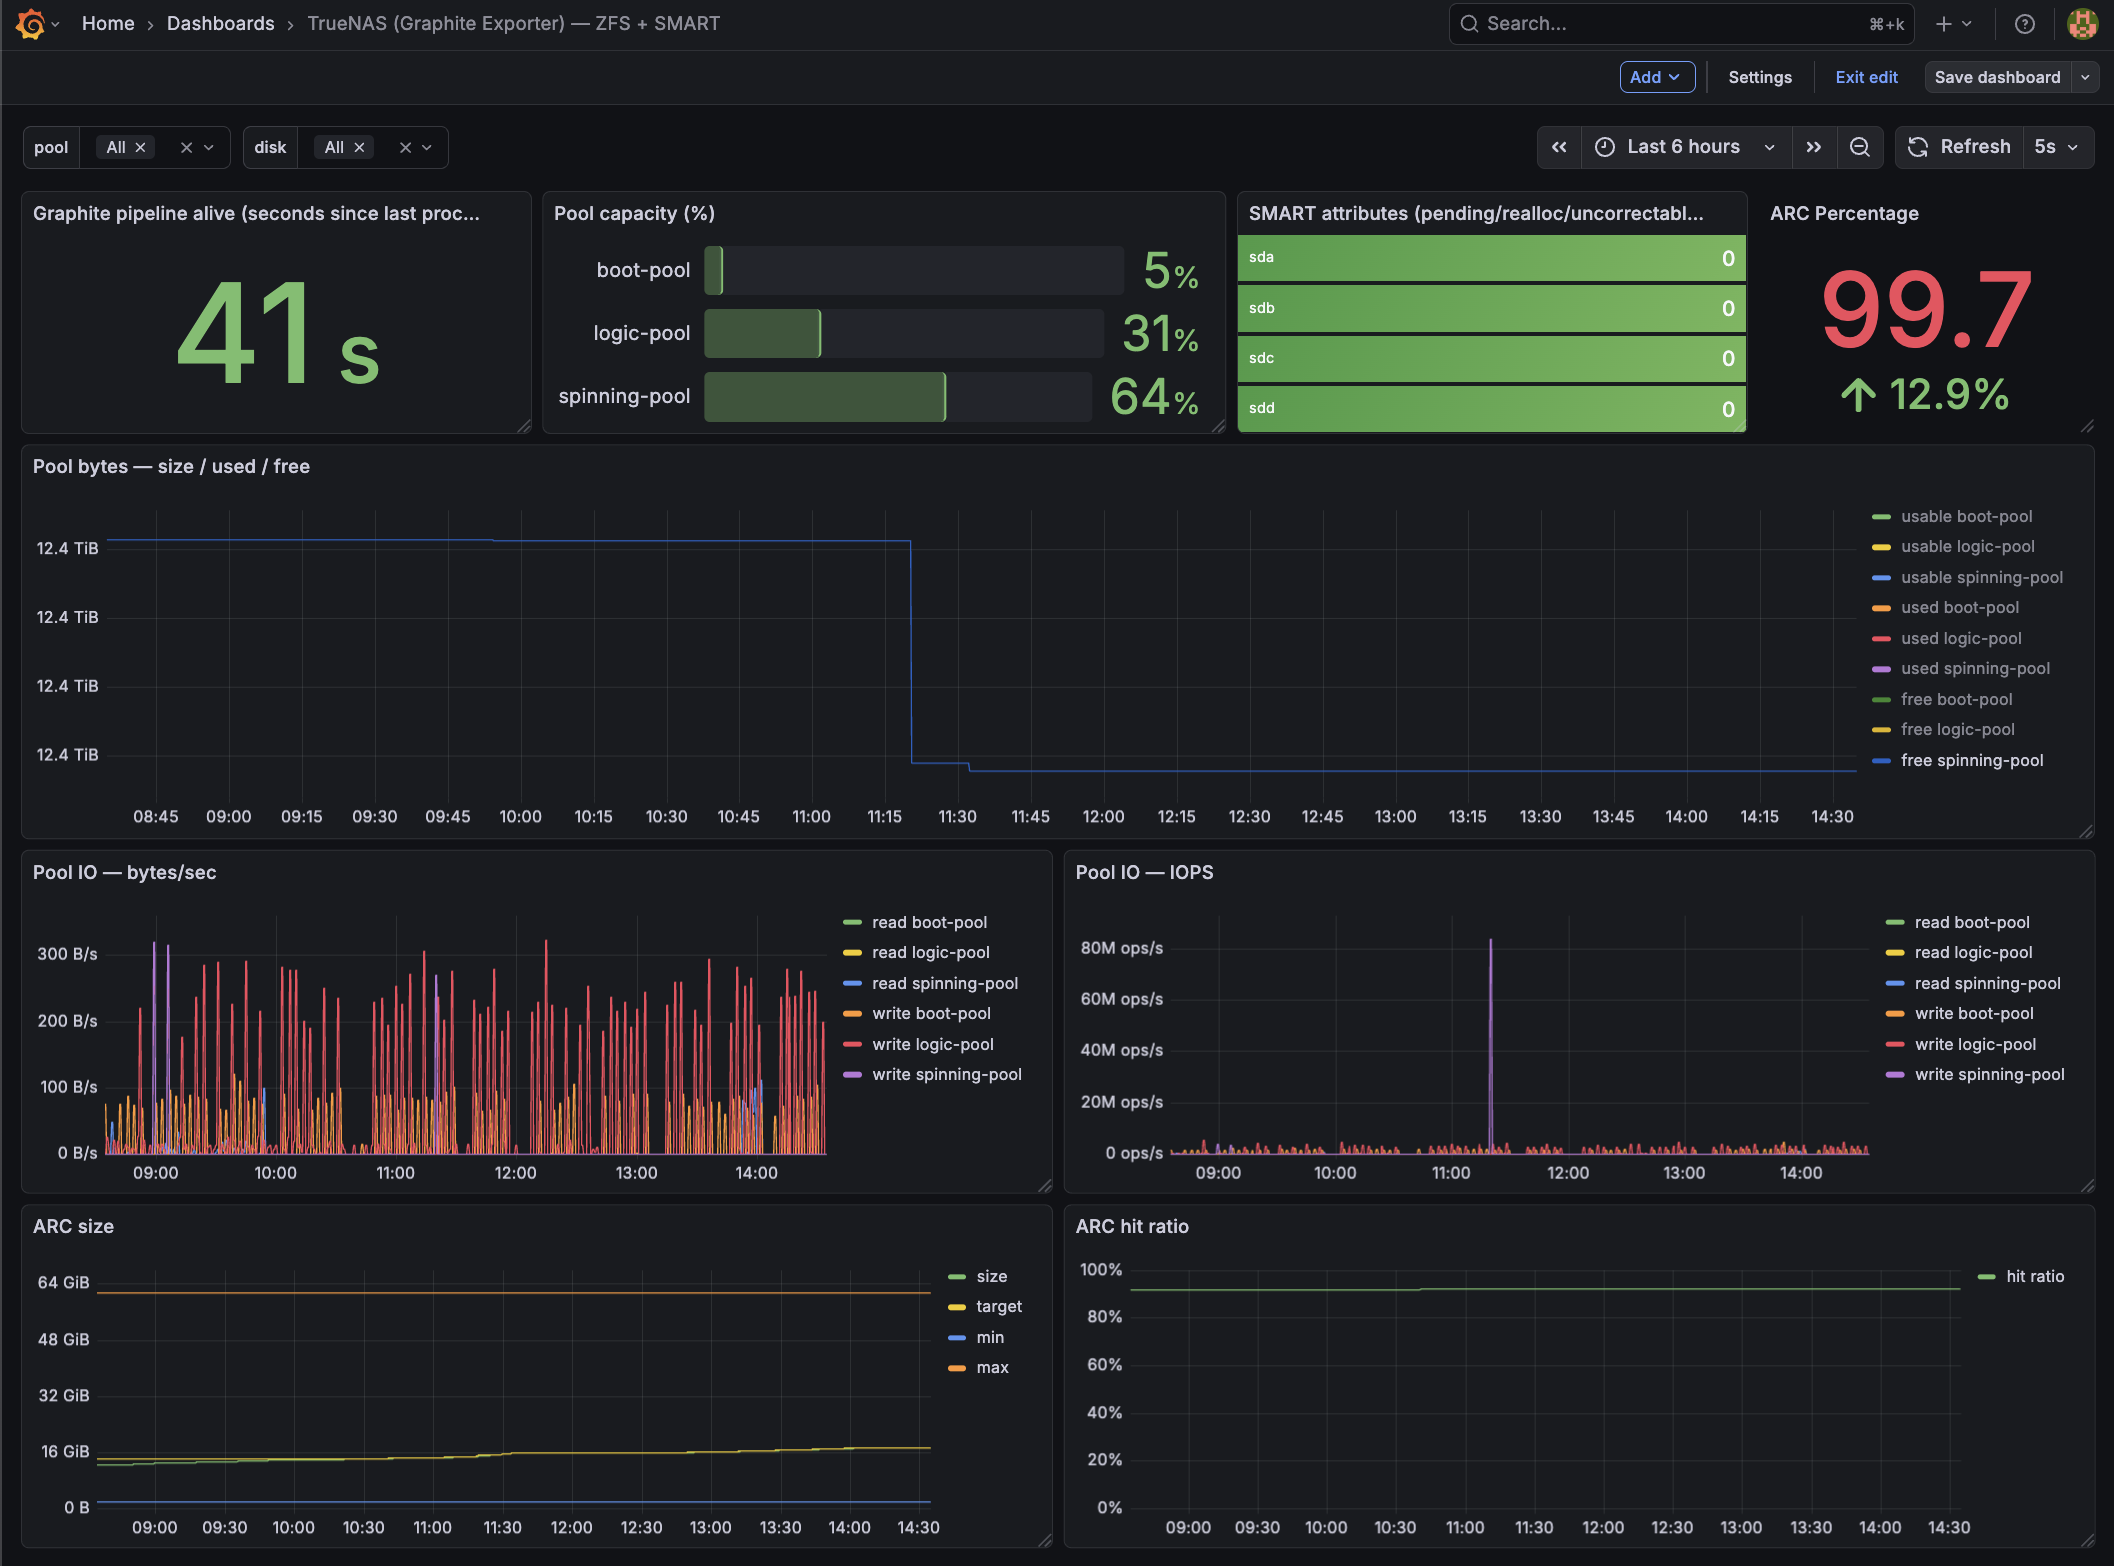
5) Grafana
Add Prometheus datasource.
Import your dashboard JSON or build panels with:
truenas_zfs_pool_used_bytes
truenas_zfs_pool_free_bytes
truenas_zfs_pool_read_bytes_per_sec
truenas_zfs_arc_size_bytes
truenas_smart_attribute_pending_sectors{disk!=""}
Grafana overview dashboard for TrueNAS SCALE: ARC, ZFS pool usage, SMART status, and network/disk activity at a glance.
6) Validation Checklist
On TrueNAS:
curl http://127.0.0.1:9108/metrics | grep truenas_
  % Total    % Received % Xferd  Average Speed   Time    Time     Time  Current
                                 Dload  Upload   Total   Spent    Left  Speed
100 1711# HELP truenas_zfs_arc_hits_total Graphite metric truenas_zfs_arc_hits_total
9 # TYPE truenas_zfs_arc_hits_total gauge
 truenas_zfs_arc_hits_total 1.492267653e+09
 truenas_zfs_arc_max_bytes 6.6212655104e+10
 truenas_zfs_arc_min_bytes 2.102699904e+09
 truenas_zfs_arc_size_bytes 1.8651633936e+10
 truenas_zfs_arc_target_bytes 1.8717149544e+10
...
 truenas_smart_attribute_pending_sectors{disk="sda"} 0
 truenas_smart_attribute_pending_sectors{disk="sdb"} 0
 truenas_smart_attribute_pending_sectors{disk="sdc"} 0
 truenas_smart_attribute_pending_sectors{disk="sdd"} 0
...
 truenas_smart_attribute_reallocated_sectors{disk="sda"} 0
 truenas_smart_attribute_reallocated_sectors{disk="sdb"} 0
 truenas_smart_attribute_reallocated_sectors{disk="sdc"} 0
 truenas_smart_attribute_reallocated_sectors{disk="sdd"} 0
...
On Prometheus jail:
fetch -o- http://172.40.0.100:9108/metrics | grep truenas_
...
truenas_zfs_arc_hits_total 1.494022629e+09
truenas_zfs_arc_max_bytes 6.6212655104e+10
truenas_zfs_arc_min_bytes 2.102699904e+09
truenas_zfs_arc_misses_total 1.23342598e+08
truenas_zfs_arc_size_bytes 1.865186692e+10
truenas_zfs_arc_target_bytes 1.8717149544e+10
...
truenas_smart_attribute_pending_sectors{disk="sda"} 0
truenas_smart_attribute_pending_sectors{disk="sdb"} 0
truenas_smart_attribute_pending_sectors{disk="sdc"} 0
truenas_smart_attribute_pending_sectors{disk="sdd"} 0
...
In Grafana:
- Data source = Prometheus
- Metrics resolve
- Panels render
Notes
zpool list≠zfs getnumbers. Pool size vs dataset logical usage differ.- ARC stats only exist on SCALE.
- SMART requires permissions for
smartctland may require running as root on SCALE. - If
smartctlreturns nothing for a disk, verify the correct device path (e.g./dev/sdXvs controller-specific paths) and that the disk is not behind a RAID controller that blocks SMART passthrough.
Failure Modes
- No metrics: graphite-exporter mapping typo
- No IO stats: your OpenZFS
zpool iostatcolumns differ - Duplicate disks: wrong PromQL grouping (use
max by (disk)) - Cron runs but emits nothing: missing
nc/smartctl/zpoolin cron environment; use absolute paths or confirm PATH in the cron runner. nc: invalid option -- N→ your netcat doesn’t support-N; use-q 0or remove the flag.
This setup is intentionally explicit and hopefully reproducible.